
| Scenario | |
|---|---|
| Timeframe | Weekly |
| Recommendation | BUY STOP |
| Entry Point | 417.50 |
| Take Profit | 448.00 |
| Stop Loss | 410.00 |
| Key Levels | 363.00, 390.00, 392.50, 404.00, 405.00, 417.00, 443.00, 448.00, 450.00 |
| Alternative scenario | |
|---|---|
| Recommendation | SELL STOP |
| Entry Point | 392.50 |
| Take Profit | 363.00 |
| Stop Loss | 400.00 |
| Key Levels | 363.00, 390.00, 392.50, 404.00, 405.00, 417.00, 443.00, 448.00, 450.00 |
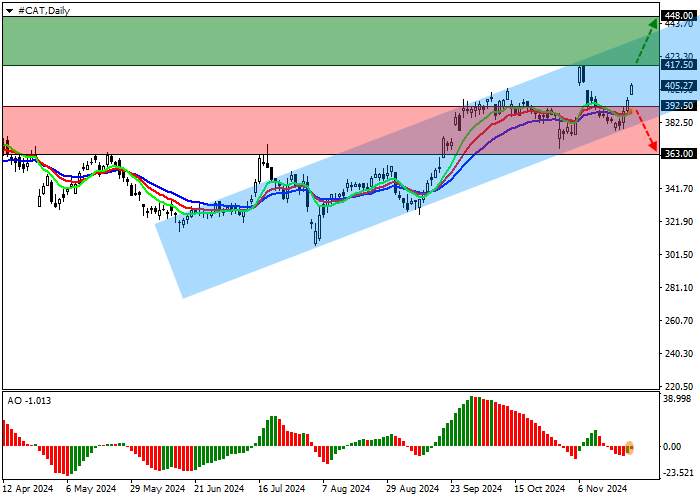
Shares of Caterpillar Inc., a manufacturer of construction and mining equipment, are trading in a correction at 405.00.
On the daily chart, the price retreats from the support line of the ascending channel with dynamic boundaries of 443.00–390.00, reversing after the correction.
On the four-hour chart, the probability of growth increases as the quotes are approaching the year’s high of 417.00, having broken the previous high of 404.00. After consolidation above, it may reach the resistance line of 450.00.
Technical indicators have given a buy signal: fast EMAs on the Alligator indicator are moving away from the signal line, expanding the range of fluctuations, and the AO histogram is forming correction bars below the transition level.
Trading tips
Long positions may be opened after the price rises and consolidates above 417.50, with the target at 448.00. Stop loss is 410.00. Implementation period: 7 days or more.
Short positions may be opened after the price falls and consolidates below 392.50, with the target at 363.00. Stop loss is 400.00.
风险提示:本文所述仅代表作者个人观点,不代表 Followme 的官方立场。Followme 不对内容的准确性、完整性或可靠性作出任何保证,对于基于该内容所采取的任何行为,不承担任何责任,除非另有书面明确说明。


加载失败()