| Scenario | |
|---|---|
| Timeframe | Weekly |
| Recommendations | BUY STOP |
| Entry point | 21150.0 |
| Take Profit | 21900.0 |
| Stop Loss | 20900.0 |
| Key levels | 19850.0, 20600.0, 21150.0, 21900.0 |
| Alternative scenario | |
|---|---|
| Recommendations | SELL STOP |
| Entry point | 20600.0 |
| Take Profit | 19850.0 |
| Stop Loss | 21000.0 |
| Key levels | 19850.0, 20600.0, 21150.0, 21900.0 |
Current dynamics
One of the leading US indices, NQ 100, is showing a correctional trend in the region of 20808.0, which is supported by strong corporate reporting of the main components.
Thus, the communications and technology company Zoom Video Communications Inc. recorded revenue at $1.18 billion, which exceeded analysts' expectations of $1.16 billion, and earnings per share (EPS) amounted to $1.38 versus the forecast of $1.31. IT giant HP Inc. will publish its financial results today: revenue is expected to grow to $13.99 billion from $13.52 billion in the previous quarter, and earnings per share will reach $0.928 after $0.830. Also due out today is technology company Dell Technologies Inc., which is expected to report revenue of $24.69 billion, down from $25.00 billion in the previous quarter but up from $22.30 billion in the same period a year earlier, and earnings per share could rise to $2.07 from $1.88 last year.
Against the backdrop of a significant rise in the dollar, yields across the entire line of leading bonds began to decline: the rate on 10-year debt securities fell to 4.291% from 4.427% recorded last week, on 20-year ones – to 4.565% from 4.684%, and on 30-year ones – to 4.479% from 4.589%.
The growth leaders in the index are Super Micro Computer Inc. ( 15.87%), DexCom Inc. ( 6.87%), Moderna Inc. ( 6.20%), GlobalFoundries Inc. ( 5.02%).
Among the leaders of the decline are Nvidia Corp. (-4.18%), AppLovin Corp. (-4.12%), Tesla Inc. (-3.96%).
Support and resistance levels
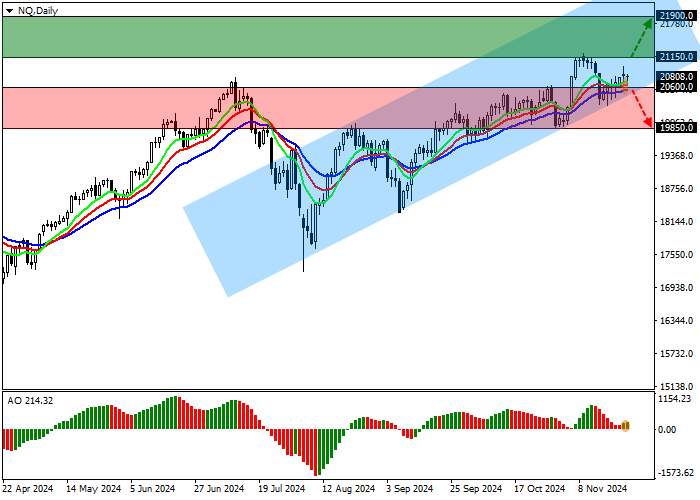
On the daily chart, the index quotes continue to correct, remaining within the channel with boundaries of 22200.0–20500.0.
Technical indicators have turned around and are holding the signal to continue buying: fast EMAs on the Alligator indicator are moving away from the signal line, and the AO histogram is forming new correction bars, holding in the buying zone.
Support levels: 20600.0, 19850.0.
Resistance levels: 21150.0, 21900.0.

Trading scenarios
In case of continued growth and consolidation of the price above the 21150.0 mark, you can open buy positions with a target of 21900.0. Stop loss — 20900.0. Implementation period: 7 days or more.
In case of a reversal and continuation of the corrective decline, as well as consolidation of the price below the support level of 20600.0, sell positions with a target of 19850.0 will be relevant. Stop loss - 21000.0.
风险提示:本文所述仅代表作者个人观点,不代表 Followme 的官方立场。Followme 不对内容的准确性、完整性或可靠性作出任何保证,对于基于该内容所采取的任何行为,不承担任何责任,除非另有书面明确说明。


加载失败()