The shares of The Home Depot Inc., the largest home improvement company, are moving in a corrective trend at 429.00.
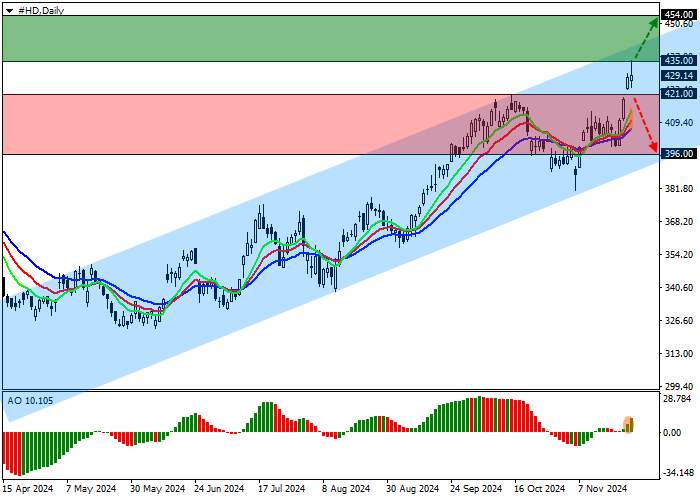
On the daily chart, the price is approaching the resistance line of the ascending channel with dynamic boundaries of 446.00–394.00.
On the four-hour chart, the potential for continued growth has increased after a breakout of the previous year’s high of 421.00. In case of consolidation above, the quotes may reach the resistance line of 450.00.
Technical indicators are ready to strengthen the buy signal: the EMA fluctuation range on the Alligator indicator is expanding in the direction of growth, and the AO histogram is forming ascending bars in the positive zone.
Trading tips
Long positions may be opened after the price grows and consolidates above 435.00, with the target at 454.00. Stop loss is around 428.00. Implementation period: 7 days or more.
Short positions may be opened after the price declines and consolidates below 421.00, with the target at 396.00. Stop loss is 430.00.


加载失败()