
| Scenario | |
|---|---|
| Time frame | Weekly |
| Recommendation | SELL-STOP |
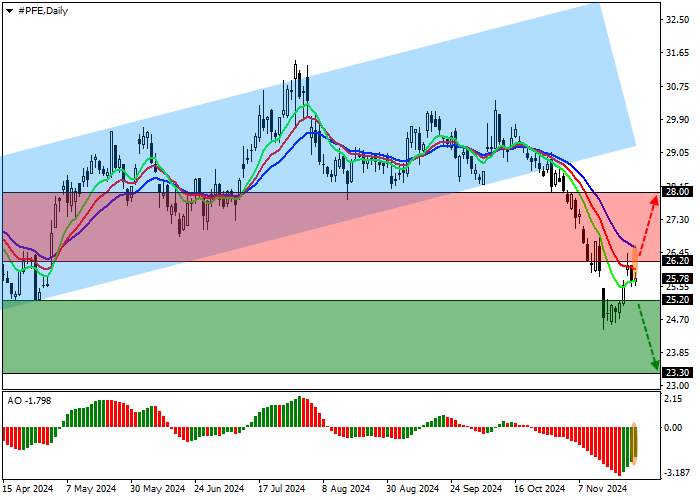
| Entry point | 25.20 |
| Take Profit | 23.30 |
| Stop Loss | 26.00 |
| The most important levels | 23.00, 24.50, 25.20, 26.00, 28.50, 29.00, 33.50 |
| Alternative scenario | |
|---|---|
| Recommendation | BUY STOP |
| Entry point | 26.20 |
| Take Profit | 28.00 |
| Stop Loss | 25.60 |
| The most important levels | 23.00, 24.50, 25.20, 26.00, 28.50, 29.00, 33.50 |
Shares of Pfizer Inc., the largest American pharmaceutical company, are correcting at the 26.00 level.
On the daily chart, the price is falling below the support line of the ascending channel with dynamic boundaries of 33.50–28.50.
On the 4-hour chart, the price has exited the range, forming a new low at 24.50, which is a key support level, after which it is expected to reach 23.00. Despite the high downside potential, there is a possibility that the asset will revisit the 29.00 channel support line, but for that, it needs to consolidate above 27.00.
Technical indicators maintain a sell signal: fast EMA on the Alligator indicator is below the signal line, while the AO histogram is forming corrective bars below the crossover level.
Trading scenarios
Short positions can be opened after the price falls and stops below the level of 25.20 with a target of 23.30. Stop-loss - 26.00. Execution time: 7 days and more.
Long positions can be opened after the price rises and stops above the level of 26.20 with a target of 28.00. Stop-loss — 25.60.
风险提示:本文所述仅代表作者个人观点,不代表 Followme 的官方立场。Followme 不对内容的准确性、完整性或可靠性作出任何保证,对于基于该内容所采取的任何行为,不承担任何责任,除非另有书面明确说明。


加载失败()