| Scenario | |
|---|---|
| Timeframe | Weekly |
| Recommendations | BUY STOP |
| Entry point | 19600.0 |
| Take Profit | 20000.0 |
| Stop Loss | 19400.0 |
| Key levels | 18800.0, 19200.0, 19600.0, 20000.0 |
| Alternative scenario | |
|---|---|
| Recommendations | SELL STOP |
| Entry point | 19200.0 |
| Take Profit | 18800.0 |
| Stop Loss | 19400.0 |
| Key levels | 18800.0, 19200.0, 19600.0, 20000.0 |
Current dynamics
Frankfurt's leading DAX 40 index is correcting at 19411.0 as the corporate earnings period ends, with investors now turning their attention back to macroeconomic data and the domestic bond market.
Thus, according to the results of November, the consumer price index in Germany adjusted from 0.4% to -0.2%, and the annual indicator - from 2.0% to 2.2%, while the index harmonized with EU standards fell from 0.4% to -0.7% and remained at 2.4% with a forecast of 2.6%, respectively, confirming the effectiveness of the monetary policy of the European Central Bank (ECB). In addition, today at 09:00 (GMT 2) statistics on retail sales were presented: in October, the indicator slowed from 1.6% to -1.5%, and in annual terms, on the contrary, it increased from 0.9% to 1.0%.
Yields on Germany's leading bonds have been falling for the month, with the 10-year rate falling to 2.124% from 2.205% last week, the 20-year to 2.342% from 2.428% and the 30-year to 2.346%, well below the November 7 peak of 2.691%.
The growth leaders in the index are Airbus Group SE ( 4.15%), Siemens Energy AG ( 3.64%), Daimler Truck Holding AG ( 2.60%), and RWE AG ( 2.28%).
Among the leaders in decline were Qiagen NV (–0.91%), Merck KGaA (–0.70%), and Brenntag AG (–0.52%).
Support and resistance levels
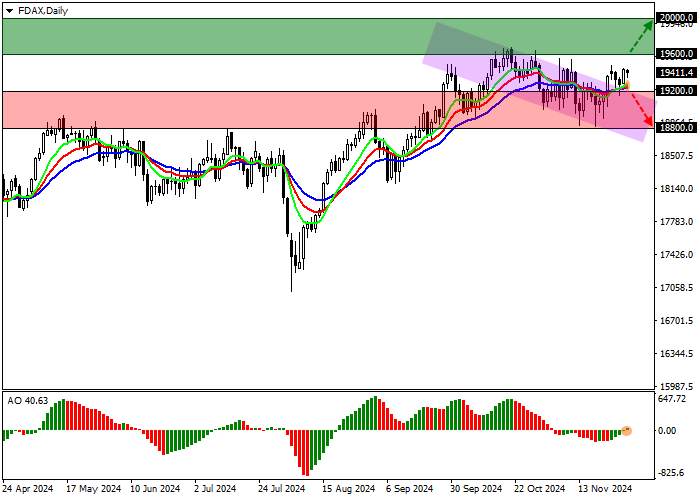
On the daily chart, the price is trading in a corrective trend, gradually moving away from the resistance line of the descending channel with boundaries of 19200.0–18500.0.
Technical indicators have managed to change the signal to an upward one: fast EMA on the “alligator” indicator are again moving away from the signal line, and the AO histogram, being in the purchase zone, is forming upward bars.
Support levels: 19200.0, 18800.0.
Resistance levels: 19600.0, 20000.0.

Trading scenarios
In case of continued growth and consolidation of the price above the resistance level of 19600.0, positions for purchase with the target of 20000.0 will be relevant. Stop loss — 19400.0. Implementation period: 7 days or more.
If the decline continues and the price consolidates below the support level of 19200.0, sell positions with a target of 18800.0 will be relevant. Stop loss - 19400.0.
风险提示:本文所述仅代表作者个人观点,不代表 Followme 的官方立场。Followme 不对内容的准确性、完整性或可靠性作出任何保证,对于基于该内容所采取的任何行为,不承担任何责任,除非另有书面明确说明。


加载失败()