
| Scenario | |
|---|---|
| Time frame | Weekly |
| Proposal | BUY STOP |
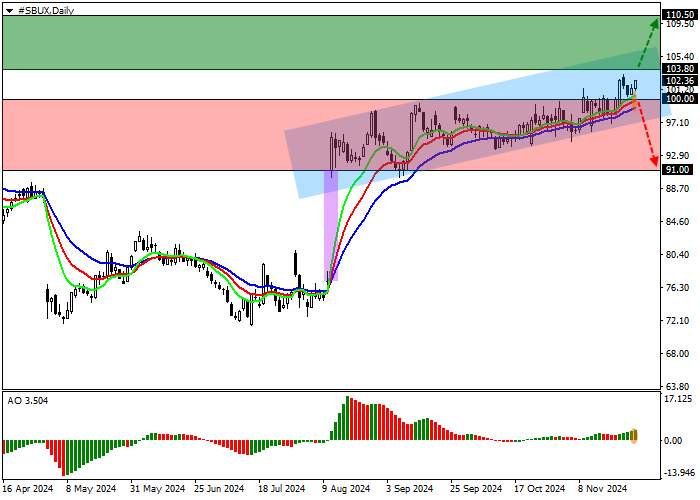
| Entry Points | 103.80 |
| Take advantage | 110.50 |
| Stop-loss | 101.00 |
| Level lock | 77.00, 90.90, 97.00, 100.00, 101.00, 102.00, 103.00, 107.00, 110.50 |
| Different scenarios | |
|---|---|
| Proposal | SELL STOP |
| Entry Points | 100.00 |
| Take advantage | 91.00 |
| Stop-loss | 102.00 |
| Level lock | 77.00, 90.90, 97.00, 100.00, 101.00, 102.00, 103.00, 107.00, 110.50 |
Shares of Starbucks Corp., one of the largest companies that own the chain of coffee shops of the same name, traded at 102.00.
On the daily chart, the price is correcting, and after the formation of a price gap of 90.90–77.00, a long-term flat develops.
On the four-hour chart, the price is moving in a trend of 107.00–97.00. Despite maintaining upside potential, the asset has yet to break through a key marker for sustained growth — the previous high at 103.00.
Technical indicators strengthen the buy signal: the fast EMA on the Alligator indicator is held above the signal line, expanding the fluctuation range, and the AO histogram forms a correction bar in the positive zone.
Trading tips
A buy position can be opened after the price rises and strengthens above 103.80, with a target at 110.50. Stop loss at 101.00. Implementation period: 7 days and more.
A sell position can be opened after the price falls and consolidates below 100.00, with a target at 91.00. Stop loss at 102.00.
风险提示:本文所述仅代表作者个人观点,不代表 Followme 的官方立场。Followme 不对内容的准确性、完整性或可靠性作出任何保证,对于基于该内容所采取的任何行为,不承担任何责任,除非另有书面明确说明。


加载失败()