
| Scenario | |
|---|---|
| Time frame | Weekly |
| Recommendation | BUY STOP |
| Entry point | 354.00 |
| Take Profit | 394.00 |
| Stop Loss | 336.00 |
| The most important levels | 233.00, 320.00, 326.00, 336.00, 344.00, 394.00, 400.00 |
| Alternative scenario | |
|---|---|
| Recommendation | SELL-STOP |
| Entry point | 326.00 |
| Take Profit | 269.00 |
| Stop Loss | 340.00 |
| The most important levels | 233.00, 320.00, 326.00, 336.00, 344.00, 394.00, 400.00 |
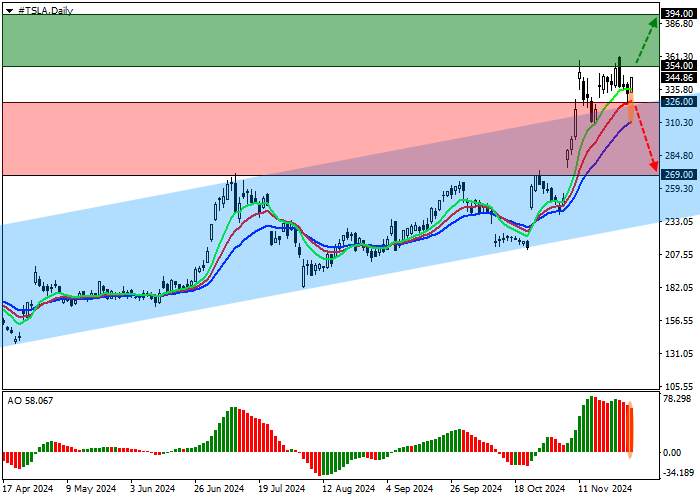
Shares of Tesla Inc., a leading manufacturer of electric cars, are trading at 344.00.
On the daily chart, the price is correcting above the resistance line of the ascending channel with dynamic boundaries of 326.00–233.00.
On the 4-hour chart, after breaking the 326.00 resistance level, prices have completed a double back test and are rising to a yearly high of 360.00, consolidation above which will allow them to reach the 400.00 area. The actual support level remains at 320.00 below the channel support line.
Technical indicators are in buy condition: fast EMA on Alligator indicator is above signal line, extending the fluctuating range, and AO histogram is forming bullish bars, rising in positive zone.
Trading scenarios
Long positions can be opened after the price rises and stops above the level of 354.00 with a target of 394.00. Stop-loss - 336.00. Execution time: 7 days and more.
Short positions can be opened after the price falls and stops below the level of 326.00 with a target of 269.00. Stop-loss — 340.00.
风险提示:本文所述仅代表作者个人观点,不代表 Followme 的官方立场。Followme 不对内容的准确性、完整性或可靠性作出任何保证,对于基于该内容所采取的任何行为,不承担任何责任,除非另有书面明确说明。


加载失败()