| Scenario | |
|---|---|
| Timeframe | Intraday |
| Recommendations | BUY STOP |
| Entry point | 1.4050 |
| Take Profit | 1.4145 |
| Stop Loss | 1.4000 |
| Key levels | 1.3862, 1.3908, 1.3958, 1.4000, 1.4050, 1.4100, 1.4145, 1.4200 |
| Alternative scenario | |
|---|---|
| Recommendations | SELL STOP |
| Entry point | 1.4000 |
| Take Profit | 1.3908 |
| Stop Loss | 1.4050 |
| Key levels | 1.3862, 1.3908, 1.3958, 1.4000, 1.4050, 1.4100, 1.4145, 1.4200 |
Current dynamics
During the morning session, the USD/CAD pair is recovering from mostly bearish trading at the end of last week, and is testing the 1.4030 mark for a breakout upwards, while traders are waiting for new drivers for quotes to move. Thus, today at 16:30 (GMT 2) and 16:45 (GMT 2), November business activity indices for Canada and the USA from S&P Global will be published: according to forecasts, the American indicator will remain at 48.8 points in the stagnation zone, but the indicator in the manufacturing sector from the Institute for Supply Management (ISM) may rise from 46.5 points to 47.5 points. In turn, the Canadian index in the manufacturing sector will adjust from 51.1 points to 50.8 points.
The Canadian currency is under pressure from the gross domestic product (GDP) statistics: in September, the indicator was adjusted from 0.0% to 0.1% month-on-month against estimates of 0.3%, and in the third quarter — from 0.5% to 0.3% quarter-on-quarter and from 2.2% to 1.0% year-on-year, meeting experts’ expectations. The positive dynamics were due to an increase in household spending by 0.9% and government spending by 1.1%, while housing investment added 0.9%, mainly due to increased activity in the secondary market. Renovation spending decreased by 0.4%, and new construction by 0.1%. Against this backdrop, the probability of a -50 basis point interest rate adjustment by the Bank of Canada next month has increased to 44.0% from 31.0%, with the possibility of a -25 basis point change fully priced in.
U.S. investors are eyeing the November labor market report later this week, which is expected to show nonfarm payrolls rising to 183,000 from 12,000, average hourly earnings falling to 0.3% from 0.4%, and unemployment remaining at 4.1%. Similar data from Canada is expected to show average hourly earnings holding steady at 4.9% and unemployment at 6.5%.
Support and resistance levels
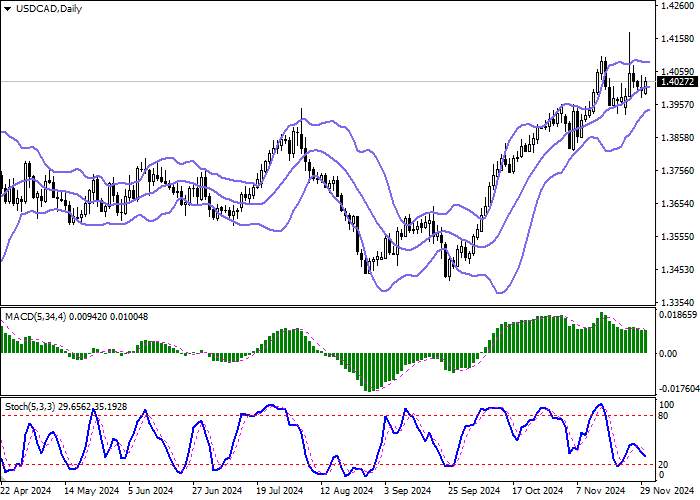
On the daily chart, Bollinger Bands are turning horizontal: the price range is slightly narrowing, indicating a mixed nature of trading in the short term. The MACD indicator is declining, maintaining a weak sell signal (the histogram is below the signal line). Stochastic is at the "20" mark, signaling the risks of oversold US dollar in the ultra-short term.
Resistance levels: 1.4050, 1.4100, 1.4145, 1.4200.
Support levels: 1.4000, 1.3958, 1.3908, 1.3862.


Trading scenarios
Long positions can be opened after a confident breakout of the 1.4050 level upwards with a target of 1.4145. Stop loss is 1.4000. Implementation period: 2–3 days.
Short positions can be opened after a rebound from the 1.4050 level and a breakout of the 1.4000 level downwards with a target of 1.3908. Stop loss is 1.4050.
风险提示:本文所述仅代表作者个人观点,不代表 Followme 的官方立场。Followme 不对内容的准确性、完整性或可靠性作出任何保证,对于基于该内容所采取的任何行为,不承担任何责任,除非另有书面明确说明。


加载失败()