| Scenario | |
|---|---|
| Timeframe | Weekly |
| Recommendation | BUY STOP |
| Entry Point | 531.30 |
| Take Profit | 562.50, 578.12 |
| Stop Loss | 520.00 |
| Key Levels | 468.75, 484.38, 500.00, 531.25, 562.50, 578.12 |
| Alternative scenario | |
|---|---|
| Recommendation | SELL STOP |
| Entry Point | 499.95 |
| Take Profit | 484.38, 468.75 |
| Stop Loss | 510.00 |
| Key Levels | 468.75, 484.38, 500.00, 531.25, 562.50, 578.12 |
Current trend
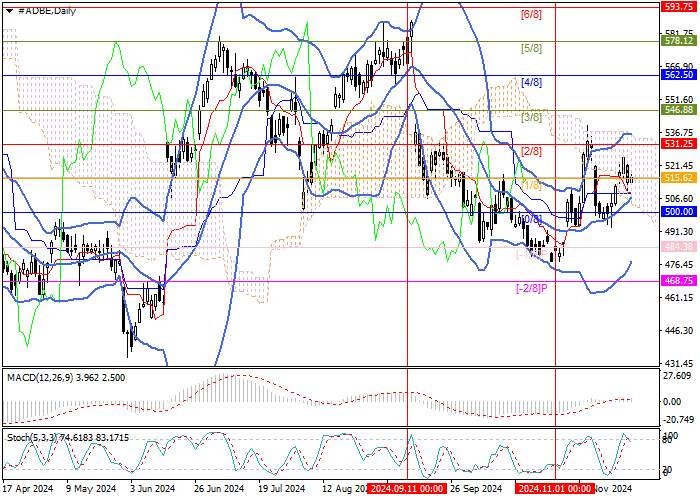
Shares of Adobe Inc., a leading American software developer, have been actively increasing since the beginning of last month, correcting to the medium-term downward trend. The price has reversed from 484.38 (Murrey level [–1/8]), returned to the main Murrey trading range, and is currently close to the key “bullish” level of 531.25 (Murrey level [2/8]). The consolidation above will allow it to reach the central zone of the trading range of 562.50 (Murrey level [4/8]) and 578.12 (Murrey level [5/8]). After a breakdown of 500.00 (Murrey level [0/8]), a decline in the lower reversal zone to the area of 484.38 (Murrey level [–1/8]) and 468.75 (Murrey level [–2/8]) may follow.
Technical indicators do not give a single signal: Bollinger bands are directed upwards, the MACD histogram is stable in the positive zone but Stochastic is reversing downwards from the overbought zone, not excluding the resumption of the downward dynamics.
Support and resistance
Resistance levels: 531.25, 562.50, 578.12.
Support levels: 500.00, 484.38, 468.75.

Trading tips
Long positions may be opened above 531.25, with the targets at 562.50, 578.12, and stop loss 520.00. Implementation period: 5–7 days.
Short positions may be opened below 500.00, with the targets at 484.38, 468.75, and stop loss 510.00.
风险提示:本文所述仅代表作者个人观点,不代表 Followme 的官方立场。Followme 不对内容的准确性、完整性或可靠性作出任何保证,对于基于该内容所采取的任何行为,不承担任何责任,除非另有书面明确说明。

暂无评论,立马抢沙发