| scenario | |
|---|---|
| chart | Weekly |
| Recommendation | SELL STOP |
| entry point | 0.6440 |
| Take Profit | 0.6350 |
| Stop Loss | 0.6500 |
| main levels | 0.6350, 0.6440, 0.6510, 0.6630 |
| alternative scenario | |
|---|---|
| Recommendation | BUY STOP |
| entry point | 0.6510 |
| Take Profit | 0.6630 |
| Stop Loss | 0.6470 |
| main levels | 0.6350, 0.6440, 0.6510, 0.6630 |
The ongoing trend
The AUD/USD currency pair is correcting in a sideways trend at 0.6467 thanks to the positive dynamics of the Australian dollar, supported by recent macroeconomic statistics. However, they are not good enough to ensure stable growth of the quotes.
According to the Australian Bureau of Statistics (ABS) report, retail sales increased by 0.6% in October, marking the third consecutive increase in the indicator ( 0.7% in August and 0.1% in September). Specifically, volume growth was recorded in the general merchandise ( 1.6%) and household goods ( 1.4%) categories, while declines were recorded in clothing, footwear and personal effects (-0.6%) and department stores (-0.3%). In addition, in October, the total number of building permits was adjusted by 4.2% to 15.498 thousand and the housing starts index was adjusted by 3.2% to AUD 8.33 billion. TD Securities inflation data for November reflected a decline in the index from 3.0% y/y to 2.9% y/y and from 0.3% m/m to 0.2% m/m, respectively. A further slowdown in the consumer price index could indicate an easing of monetary policy by the Reserve Bank of Australia (RBA), which has so far taken a neutral stance.
The US dollar is trading at 106.50 points on the USDX, supported by economic data for November, with the manufacturing index rising to 49.7 points from 48.5 points and the same measure from the Institute for Supply Management (ISM) rising to 48.4 points from 46.5 points. The industrial price index fell to 50.3 points from 54.8 points.
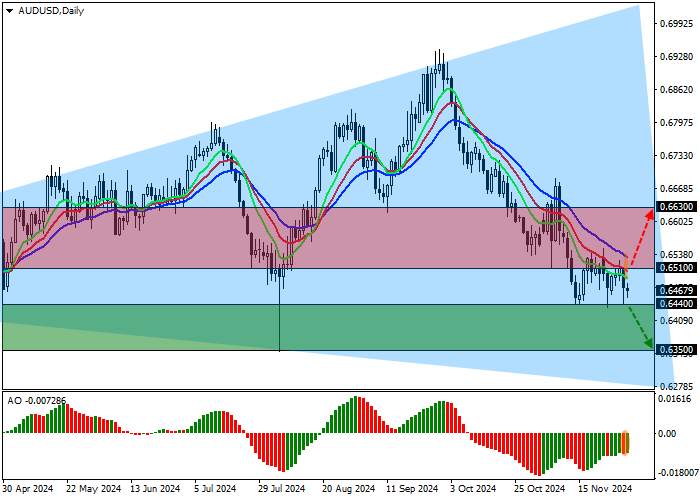
support and resistance
In the daily chart, the trading instrument corrects above the support line of the "Expanded Formation" with dynamic boundaries at 0.7000-0.6300.
The technical indicators are strengthening their sell signal: the fast EMAs of the Alligator indicator are pointing downwards and are keeping a stable distance from the signal line; the AO histogram is in the negative zone.
Supports: 0.6440, 0.6350.
Resistances: 0.6510, 0.6630.

trading tips
Short positions are relevant in case of downward movement with price consolidation below 0.6440 with price target of 0.6350 and stop loss at 0.6500. Validity: 7 days or more.
Long positions are intact in case of upside movement with price consolidation above 0.6510 with price target of 0.6630 and stop loss at 0.6470.
风险提示:本文所述仅代表作者个人观点,不代表 Followme 的官方立场。Followme 不对内容的准确性、完整性或可靠性作出任何保证,对于基于该内容所采取的任何行为,不承担任何责任,除非另有书面明确说明。

暂无评论,立马抢沙发