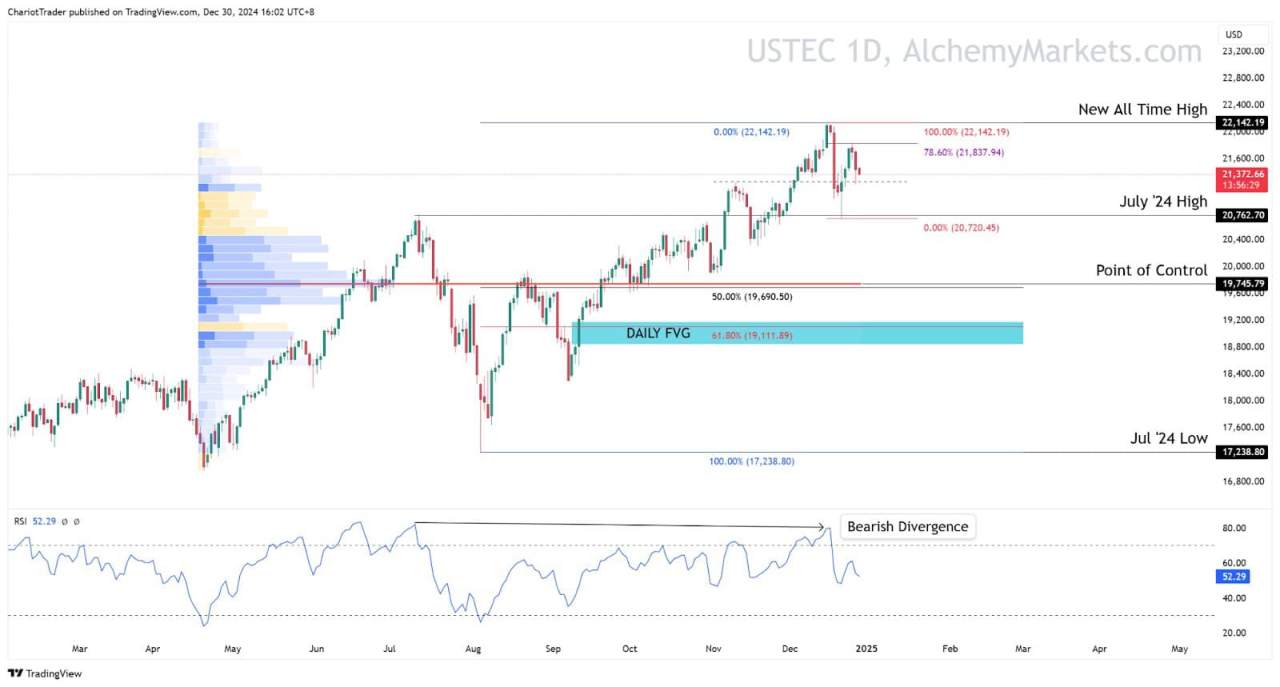
The Nasdaq 100 (USTEC) is now trading near its previous high at $21,260.51 after a rejection from the 78.60% Fibonacci Retracement at $21,837.94. The weekly chart shows bearish RSI divergence, signalling a potential loss of momentum.
USTEC’s immediate support lies at the July 2024 High ($20,762.70), a critical pivot for traders monitoring short-term pullbacks. Below this, the Point of Control (POC) at $19,745.79, a high-volume area, offers the next layer of support.
If selling pressure intensifies, the Daily Fair Value Gap (FVG) around $19,111.89, which aligns with the 61.8% Fibonacci retracement, becomes an essential area to watch.
On the upside, breaking above the 78.6% Fibonacci level could lead to a test of the new all-time high ($22,142.19). However, the bearish RSI divergence remains a cause for caution, as it often precedes price reversals or consolidations.
Going into Q1, the Federal Reserve may begin to hold rates with hawkish caution, exerting some bearish pressure on the Nasdaq. However, a break below the Jul ‘24 Low at $17,238,80 is required for the bearish divergence to be confirmed, which is nearly a 20% decline – and that just seems too far and away for us to consider at the moment.
Key Levels to Watch:
| Minor Resistance | 78.6 Fib Retracement: $21,837.94 |
| Major Resistance | New All-Time-High: $22,142.19 |
| Minor Support | July ‘24 High: $20,762.70 |
| Major Supports | Point of Control: $19,745.79 61.8% Fibonacci Retracement: $19,111.89 |
Fundamental Analysis
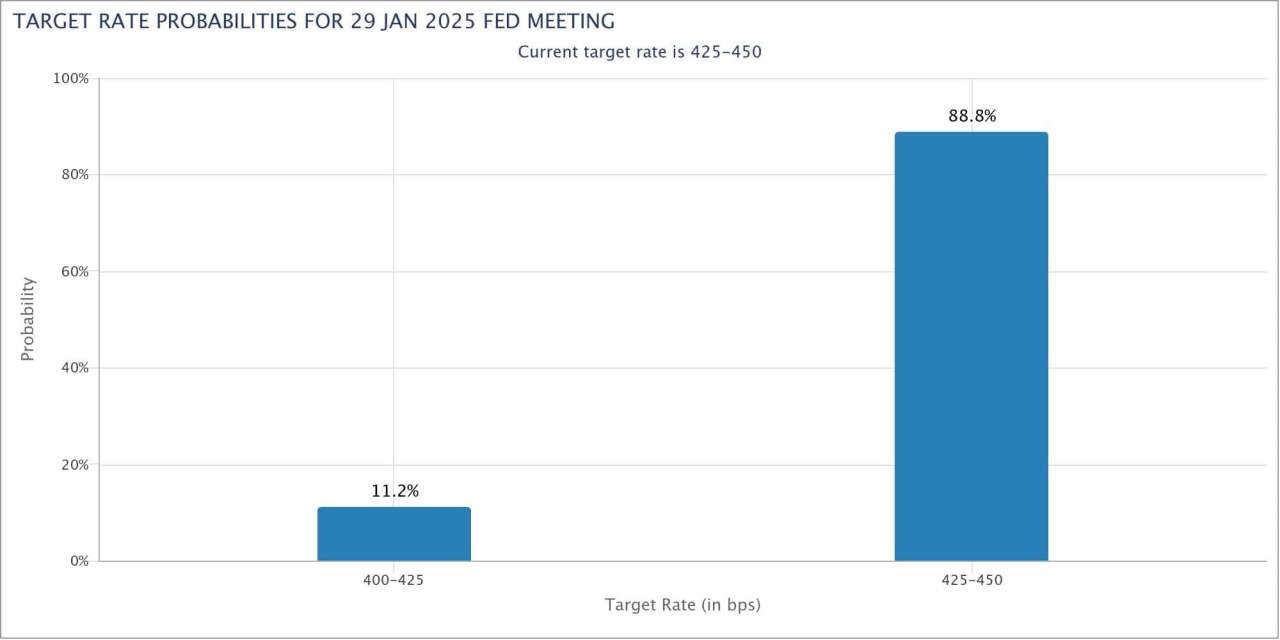
The Nasdaq 100’s recent rejection coincides with shifting expectations around the U.S. Federal Reserve policy’s hawkish shift. According to the Fedwatch Tool, there is now an 88.8% probability that Feds will hold rates in the coming January meeting – leading investors to become more cautious (Risk-off).
Slowing revenue growth from major tech firms like Microsoft and Amazon has tempered optimism, even as recent earnings exceeded expectations. Additionally, geopolitical tensions, particularly between the U.S. and China, continue to weigh on the semiconductor and hardware sectors. These factors create a mixed backdrop for the Nasdaq 100 as it approaches key resistance levels.
Key Takeaway:
With momentum signals weakening, a drop is possible – however, key support levels can support the overarching bullish trend.
风险提示:本文所述仅代表作者个人观点,不代表 Followme 的官方立场。Followme 不对内容的准确性、完整性或可靠性作出任何保证,对于基于该内容所采取的任何行为,不承担任何责任,除非另有书面明确说明。

暂无评论,立马抢沙发