「How to interpret stock price fluctuations?」 This is the most urgent question that every new investor wants to know. In markets such as the Taiwan stock market, U.S. stock market, and Hong Kong stock market, the fluctuations in stock prices affect the heartbeat of every investor. According to surveys, investors who master technical analysis have an average return rate that is 35% higher than that of blind traders. However, beginners often incur losses due to misjudging signals of price increases and decreases. This article will teach you step by step how to establish a complete judgment logic from technical analysis, fundamental interpretation to market psychology, allowing you to use professional methods to grasp the timing of buying and selling!

Why is understanding the ups and downs of stocks the key to making money in investing?
Most people often fall into the trap of "buying high and selling low," and the root cause lies in the lack of a systematic analytical framework. For example:
- Short-term fluctuation:TSMC (2330) may rise or fall 3% in a single day due to quarterly results
- Long-term trend:The AI industry chain is driven by global demand, and relevant stocks have risen by more than 50% annually
To avoid being led by the market, data tools and analytical methods must be combined. Choose a reliable professional broker, master practical charts and real-time market, help you quickly interpret long and short signals, reduce the risk of blind orders.
The basic concept of stock prices: Understanding the meaning behind the numbers
Before learning how to predict stock rises and falls, first master the 5 basic price fundamentals:
Opening Price:The first transaction price of the day reflects the overnight market sentiment
Closing Price:The last transaction price determines the basis for the price fluctuation limit for the next day
High point/Low point:The daily stock price fluctuation range, determining the bullish and bearish forces
Price fluctuation calculation formula:
Current price - Previous day's closing price) ÷ Previous day's closing price × 100%
Example: TSMC (2330) closed at NT$780 the day before yesterday and NT$800 today. → Increase of 2.56%
Ultima Markets Reminder:Using the platform's built-in Transaction Calculator, input prices are automatically converted to potential profit and loss, avoiding manual calculation errors.
Volume and Turnover
- Transaction volume: The total number of stocks bought and sold on that day.
- Transaction amount: The sum of transaction volume and transaction price.
- Impact of trading volume: A large trading volume indicates an active market, and stock prices may fluctuate more.
The Underlying Logic of Stocks: Supply and Demand Determine Price
How do stocks rise and fall? Investors need to analyze a number of factors that affect the price of a stock.
1. How is the stock price formed?
The rise and fall of stocks comes from the struggle between the "buyers" and "sellers ":
- Buy orders > Sell orders, prices rise: When investors generally have a positive outlook on a certain stock, buying pressure increases, driving the price up.(For example: Foreign investors massively bought overweight Taiwan stock heavyweight stocks)
- Sell order > Buy order, price falls: When market confidence is insufficient, selling pressure increases, leading to a decline in stock prices.(For example: Geopolitical risks trigger retail investors to sell off.)
Different market rules may also affect the magnitude of fluctuations:
- Taiwan stocks: Common stocks fluctuate by 10%, emerging stocks by 20%
- U.S. stocks: No limit on price fluctuations, may experience sharp rises and falls in a single day
2. 4 Core Factors Affecting Stock Prices
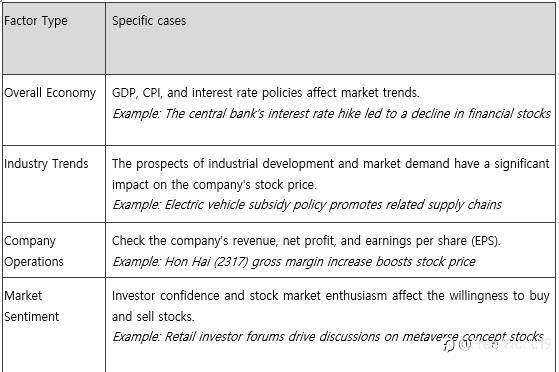
Technical Analysis: Using Charts and Indicators to Predict Stock Rises and Falls
By studying historical market data such as stock prices and trading volumes, and using statistical and graphical analysis techniques, we can predict future price trends and assist investors in formulating buying and selling strategies. The main methods include candlestick charts, moving averages, relative strength index (RSI), and moving average convergence divergence (MACD). These tools reveal market trends and potential buy and sell signals through visualization and data calculations.
1. K-line Pattern Practical Teaching
The K-line chart, also known as the candlestick chart, is a commonly used chart type in technical analysis. Each K-line contains the opening price, closing price, highest price, and lowest price, reflecting price changes through different colors and shapes. Investors can identify market trends through K-line charts, such as upward trends, downward trends, or sideways consolidation. Trend lines are straight lines that connect price highs or lows, used to confirm support and resistance levels and to determine the possible direction of price movement.
- Crosshairs:The appearance at a high point may indicate a reversal(Comparison of multiple time period candlestick charts)
- Morning/Evening Star:Three-day combination form judgment of bullish and bearish reversal
- Breakthrough neckline:W bottom/M top shape confirmation trend direction

▲Crosshair diagram

▲Morning Star K Line

▲Night Star K-Line
2. 3 Application Techniques of Major Technical Indicators
- Moving Average (MA):
The moving average is the average of closing prices over a certain period, forming a smooth curve used to show price trends. Common moving averages include short-term (such as 5-day, 10-day), medium-term (such as 20-day, 50-day), and long-term (such as 100-day, 200-day) averages. When the short-term average crosses above the long-term average, it forms a "golden cross," which may signal a buying opportunity; conversely, when the short-term average crosses below the long-term average, it forms a "death cross," which may signal a selling opportunity. The moving average is suitable for determining market trends; when the price breaks through the MA, it often indicates a market reversal.
- Golden Cross (5-day line breaks above 20-day line) = short-term buy signal
- Death cross (5-day line falls below 60-day line) = trend weakening warning signal
tips:Ultima Markets supports adding averages with one click, and customizing cycles for quick validation.
- MACD Indicator:
MACD consists of the fast line (DIF), the slow line (DEA), and the histogram, used to determine price trends and momentum. When the DIF crosses above the DEA, it forms a "golden cross," which may indicate a buy signal; conversely, when the DIF crosses below the DEA, it forms a "death cross," which may indicate a sell signal. The histogram reflects the gap between the two lines, showing the strength of the trend. Using them in combination can more accurately capture short-term market fluctuations and breakout points.
- The column body changes from negative to positive → Bullish momentum strengthens
- Divergence (new high in stock price but MACD declining) = Potential selling opportunity
- RSI Relative Strength Index:
The RSI is a technical indicator that measures the speed and change of price movements, with values ranging between 0 and 100. Generally, an RSI above 70 is considered overbought, potentially indicating a price pullback, while below 30 is seen as oversold, possibly signaling a price rebound. Investors can use the RSI to determine if the market is in an extreme state, aiding in buy or sell decisions.
- RSI > 70 → Overbought area, consider taking profits
- RSI < 30 → Oversold area, look for rebound opportunities
3. Key Signals in the Volume-Value Relationship
- Price increase and volume increase:Trend health (for example: MediaTek (2454) surged with volume after the investor conference)
- Price drops with shrinking volume:Selling pressure eases, may stop falling
- Abnormal explosion volume:Main force entry and exit traces (using the main force capital flow tool for monitoring)
Fundamental Analysis: Uncovering the Intrinsic Value of a Stock
1. Key points for interpreting financial report data
Analyzing the company's financial statements, such as the income statement, balance sheet, and cash flow statement, can provide insights into the company's profitability and financial health. Key indicators include earnings per share (EPS), price-to-earnings ratio (P/E), and return on equity (ROE), among others.
- Price-to-Earnings Ratio (PE):The average PE of the Taiwan stock market is about 15 times, and technology stocks can accept a higher valuation
- ROE Return on Equity:More than 15% indicates strong profitability for the company (e.g., Delta Electronics 2308)
- Free Cash Flow:Companies with positive cash flow are highly resistant to market downturns
2. Industry Cycles and Policy Implications
Macroeconomic indicators, such as GDP growth rate, inflation rate, and interest rates, affect overall market performance. In addition, industry development trends and competitive conditions also impact the performance of individual companies.
- Growth period: Semiconductor equipment demand explosion (e.g. Jingding 3413)
- Recession period: Traditional manufacturing industry faces inventory adjustment
- Policy dividends: Government green energy subsidies drive the wind power sector
tips:Ultima Markets Economic Calendar integrates global financial data to anticipate market fluctuations in advance!
Market Sentiment: An Invisible but Critical Driver of Rises and Falls
News events and market rumors may trigger fluctuations in investor sentiment, which in turn can affect stock prices. For example, significant policy changes, company merger news, or global economic events can lead to drastic market fluctuations. Therefore, investors should closely monitor relevant information and maintain rational judgment.
1. Emotion Quantification Tool
- VIX panic index: >40 indicates excessive market fear, which may lead to a bottom rebound
- Financing balance: The financing utilization rate of the Taiwan stock market > 60% requires caution for overheating
2. Newspaper event operation mindset
- Good news exhausted: The stock price fell after the announcement of the company's merger and acquisition news
- Bearish consolidation: Earnings reports are worse than expected, but the stock price does not break the previous low
Risk Management: Response Strategies for Misjudging Price Movements
After understanding the concepts and techniques of stock price fluctuations, it is crucial to develop suitable investment strategies and risk management plans. Investors should choose long-term investment or short-term trading strategies based on their own risk tolerance. Additionally, setting profit-taking and stop-loss points and strictly adhering to them helps control potential losses. Diversifying investments across different industries and asset classes is also an effective way to reduce risk.
1. Stop Loss/Stop Profit Setting Principle
- Fixed ratio method: Losses up to 7% are immediately exited
- Wave Adjustment Method: Dynamically Set According to ATR Indicator
2. Warehouse Position Control Principles
- Rule of 333: single target <30%, single day trade <30% capital, 30% cash retained
- Pyramid Plus: Buy in batches after trend confirmation
tips:Ultima Markets one-click setting for trailing stop loss, automatically locking in profits and controlling risks!
Practical case: Comprehensive analysis of the rise and fall of Taiwan stocks and U.S. stocks
Case 1: TSMC (2330) technical reversal signal
Taking the Taiwan stock market in 2024 as an example, benefiting from the growth in demand for artificial intelligence-related hardware, TSMC's stock price rose by 81% that year, marking its best annual performance since 1999. This shows that under the combination of technical analysis and fundamental analysis, investors can capture opportunities for market upswings.
Case 2: NVIDIA (NVDA) Financial Report Trading Operations
- Preliminary analysis: AI chip demand growth, PE lower than peers
- Data validation: Revenue year-on-year growth rate > 50%, gross profit margin improvement
- Result: The stock price rose 8% in a single day after the financial report was released
The Necessity of Rationally Using Tools in the Stock Market: Utilizing Technology to Overcome Human Weaknesses
When investing in stocks, obtaining real-time and professional market analysis is crucial for making informed trading decisions. Ultima Markets understands the needs of investors and has specifically integrated Trading Central's top analytical tools to provide clients with professional technical analysis and trading strategy recommendations. Through Trading Central's technical insights, investors can gain clear trend lines, key price levels, and technical conditions, easily interpret market trends, and take action in real time.
1.Trading Central Intelligent Analysis Tool
- Data integration efficiency: Simultaneously monitor Taiwan stocks, U.S. stocks, and foreign exchange markets to avoid missing cross-market linkage opportunities
- Decision objectivity: Use technical indicator signals to filter emotional trading (e.g.: automatically remind to reduce positions when RSI is overbought)
- Strategy backtesting validation: Testing the win rates of methods such as "moving average crossover" and "MACD divergence" through historical data
2.Expert Advisor (EA) Functions
The MetaTrader 4 (MT4) trading platform supports the Expert Advisor (EA) feature, allowing investors to use automated trading robots to create personalized automated trading strategies. This not only enhances trading efficiency but also enables investors to respond quickly to market fluctuations and seize trading opportunities.
Ultima Markets offers a free technical indicator library and advanced top features. Click to register to unlock all system tools!
Conclusion: 3 Steps to Improve Stock Market Trend Judgment
- Establish an analytical framework: Technical aspect (40%) + Fundamental aspect (40%) + Sentiment aspect (20%)
- Make good use of intelligent tools: Ultima Markets offers over 50 types of technical indicators and financial databases
- Demo Verification Strategy: Open an Ultima Markets Demo Account and test trading programs at no cost
Take action now!
Click to register an 【Ultima Markets】 account,free to use:
✅Real-time Taiwan stock market, U.S. stock market quotes
✅ Professional K-line charts and technical indicators
✅ Economic calendar and news impact analysis
✅ Simulated trading practice environment
Master the key to stock price fluctuations and start building your investment advantage now!
风险提示:以上内容仅代表作者或嘉宾的观点,不代表 FOLLOWME 的任何观点及立场,且不代表 FOLLOWME 同意其说法或描述,也不构成任何投资建议。对于访问者根据 FOLLOWME 社区提供的信息所做出的一切行为,除非另有明确的书面承诺文件,否则本社区不承担任何形式的责任。
FOLLOWME 交易社区网址: www.followme.ceo


加载失败()