
In the fast-moving world of gold trading, having the right tools and knowing how to use them with precision is key to consistent results. In this article, we’ll introduce the gold-trading indicators that professional XAUUSD traders consider their “edge” for capturing opportunities.
Why Use Gold Trading Indicators?
Before we dive into which indicators stand out, it’s worth asking why they matter. Gold trading is like a high-level strategy game. You need to read the field, analyze what’s unfolding, and make timely decisions. Indicators act like a clear lens over the price chart revealing trend direction, clean entry and exit windows, and early risk alerts you might miss.
A quick reminder: indicators aren’t a 100% formula for success. The edge comes from learning how each tool works and combining them with broader analysis, market structure, risk management, and fundamentals to make better decisions over time.
1) Moving Average (MA) — a clear read on trend
A Moving Average helps smooth out price action so you can see gold’s underlying trend.
The 50-day MA and 200-day MA are among the most widely used.
How to use:
- Price above the MA → bullish bias (uptrend)
- Price below the MA → bearish bias (downtrend)
- Crossovers between two MAs → potential trend shift
Tip: Combine multiple MA lengths (e.g., 20/50/200) to confirm signals and reduce false positives.
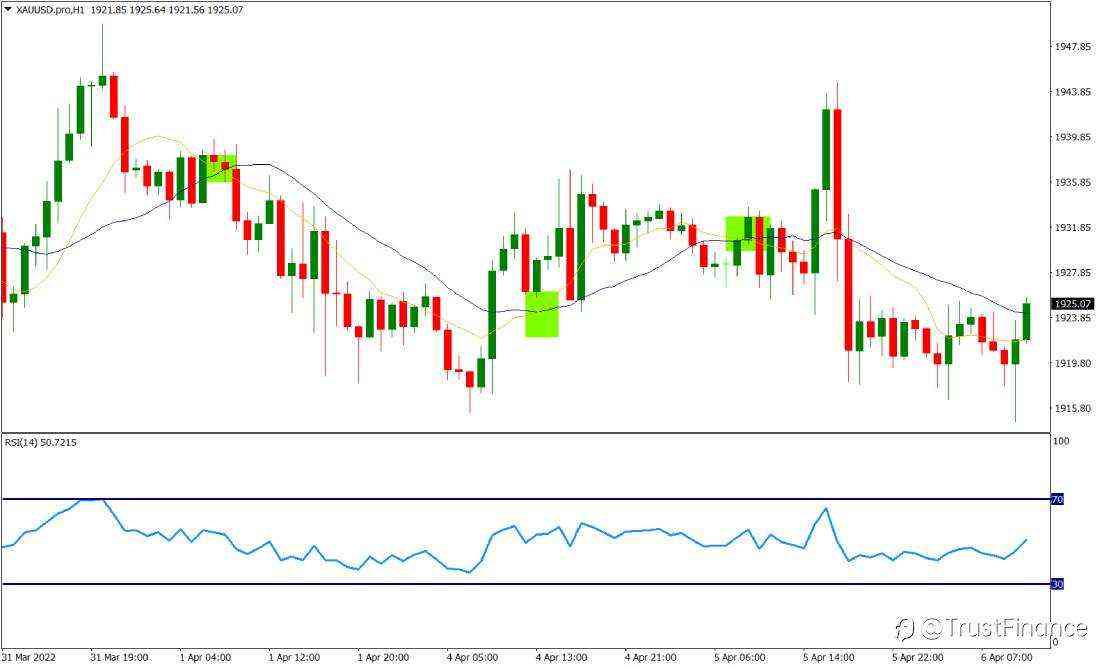
Example: XAUUSD (H1) with short- and long-term Moving Averages and RSI(14). Highlighted areas show MA crossovers used for timing. Source: AXI
2) Relative Strength Index (RSI) — a read on price momentum
RSI is an oscillator that measures the strength of recent price moves. It helps flag when gold may be overbought or oversold.
How to use
- RSI > 70: Potential overbought conditions — watch for pullbacks or consolidation.
- RSI < 30: Potential oversold conditions — price may rebound.
- Divergence: When price makes a new high/low but RSI does not, it can signal a possible reversal.
Tip: Don’t use RSI in isolation. Combine it with other indicators and market context (trend, levels, news/fundamentals) to improve decision quality.
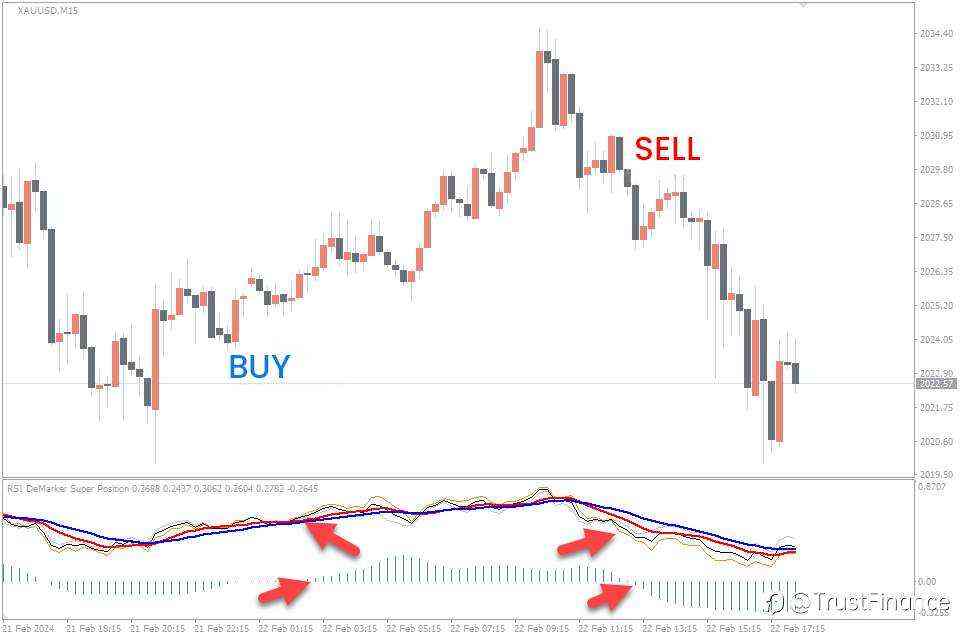
Example: XAUUSD (M15) with RSI-based signals highlighting potential buy/sell zones.Image edited for illustration by TrustFinance. Source: IndicatorSpot (indicatorspot.com)
3) Bollinger Bands — dynamic support & resistance
Bollinger Bands use three lines: a middle SMA and an upper/lower band based on standard deviation. They help you read volatility and spot trading opportunities.
How to use
- Price near the upper band: Possible sell/re-balance zone — but in strong trends price can ride the band.
- Price near the lower band: Possible buy/recovery zone — but in heavy downtrends price can break below and keep falling.
- Band width: Volatility gauge. Narrow = quiet market, Wide = high volatility.
Tip: Watch classic Bollinger patterns like “W Bottom” and “M Top.” Combine band signals with trend context and another indicator (e.g., RSI/MA) to filter false setups.
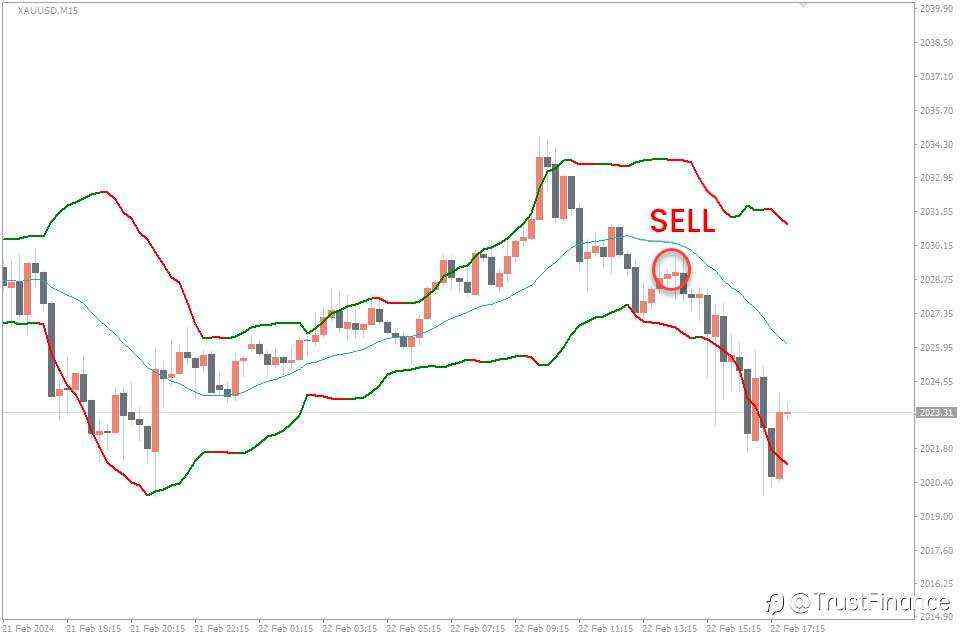
Example: XAUUSD (M15) with Bollinger Bands (SMA mid, ±2σ). The marked area shows a sell setup as price fails at the mid-band.Image edited for illustration by TrustFinance.Source: IndicatorSpot (indicatorspot.com).
4) MACD (Moving Average Convergence Divergence) — timing entries and exits
MACD is built from moving averages. It helps you read trend strength and spot practical entry/exit signals.
How to use
- MACD line crosses above the Signal line: potential buy setup.
- MACD line crosses below the Signal line: potential sell setup.
- Divergence: If price makes a new high/low but MACD doesn’t, it can hint at a possible reversal.
Tip: Pair MACD with another tool (e.g., RSI or trend MAs) to confirm direction and filter false signals.
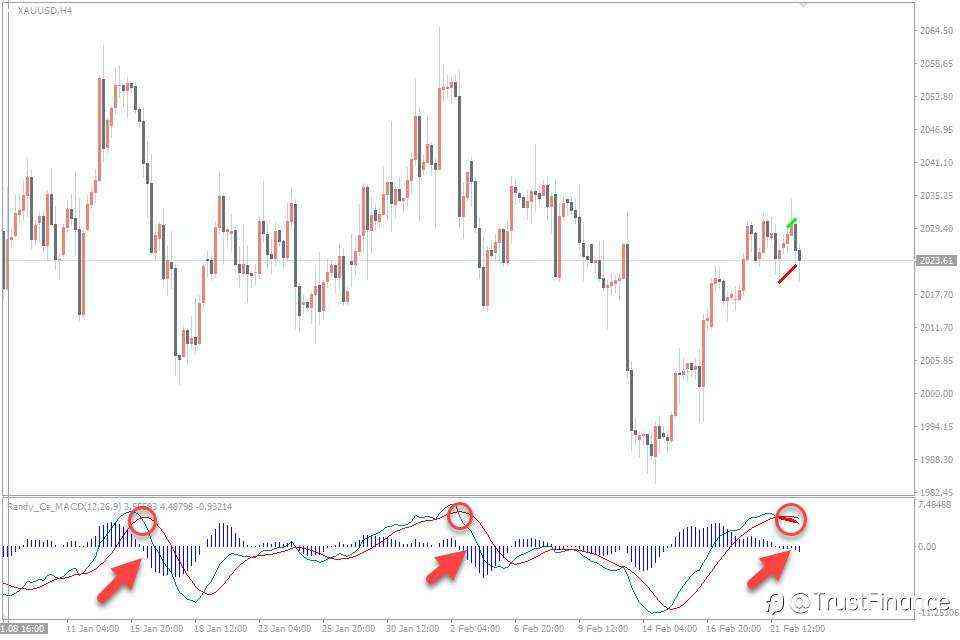
Example: XAUUSD (H4) with MACD (12, 26, 9). Circles highlight MACD–Signal crossovers and changing histogram momentum. Source: IndicatorSpot (indicatorspot.com).
5) Fibonacci Retracement — a classic tool for entry/exit zones
Fibonacci Retracement uses Fibonacci ratios to map potential support/resistance levels. It’s useful for planning entries and exits within a larger trend.
How to use
- In an uptrend: draw the Fib from the swing low → swing high.
- In a downtrend: draw from the swing high → swing low.
- Watch how price reacts at key levels—especially 61.8%, 78.6%, and 88.7%.
- Look for confirmation (e.g., rejection wicks, structure breaks, RSI/MACD alignment) before placing trades.
Tip: Use Fibonacci Extension levels to set profit targets, and pair them with risk controls (stop-loss below/above the prior swing) for a balanced plan.
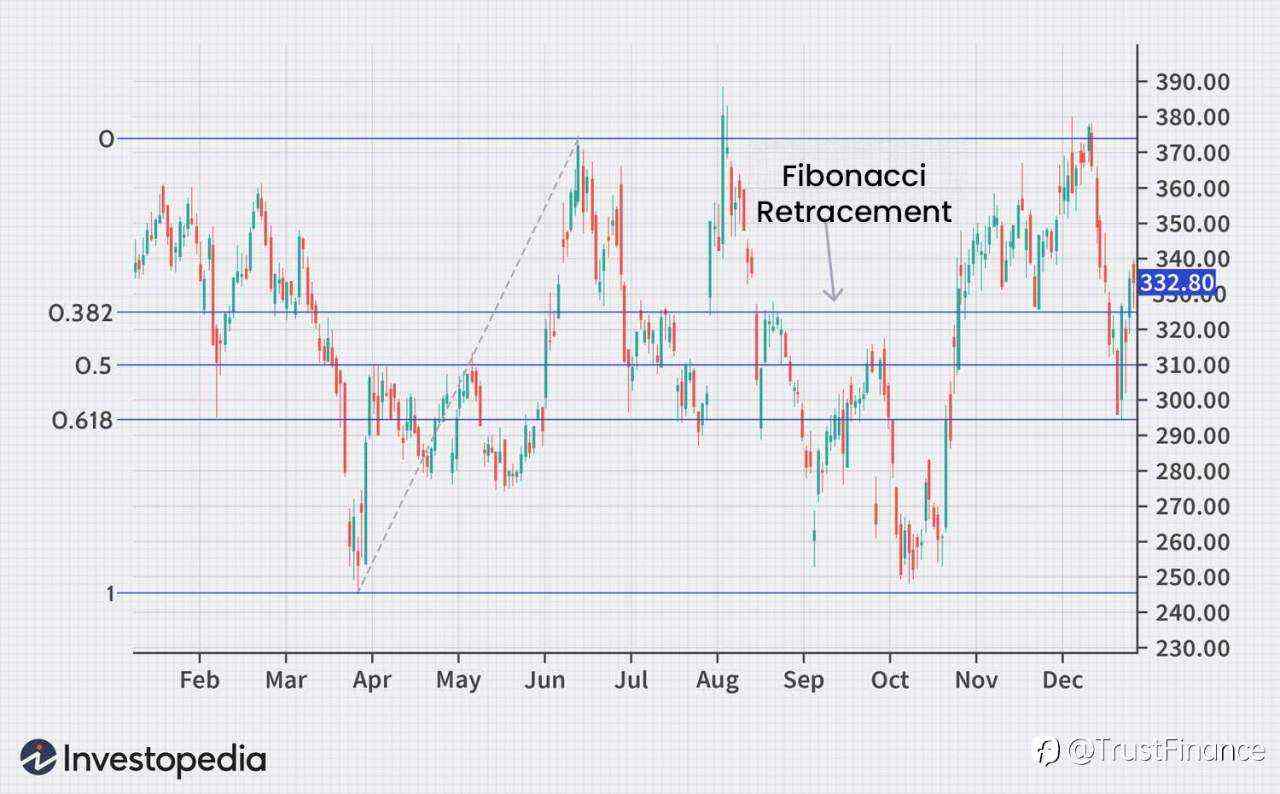
Example: Fibonacci Retracement illustrating pullback zones on a price chart. Source: Investopedia (investopedia.com)
Pro tips for using gold-trading indicators
- Combine tools, don’t rely on one.
- No single indicator is perfect. Using a few together helps confirm signals and manage risk.
- Tune the settings to your style.
- Test periods and parameters (e.g., MA lengths, RSI period) on the timeframes you trade, then keep what works.
- Keep fundamentals in view.
- Indicators are one part of the picture. Track drivers of gold such as monetary policy, inflation data, and global growth.
- Practice before going live.
- Build consistency in a demo account first, then move to real trades with clear rules.
- Review mistakes and iterate.
- No one wins every trade. Log outcomes, learn from errors, and refine the plan.
Key Takeaways
Gold-trading indicators are powerful tools that help you read price action and find better opportunities. But they’re not magic and they won’t make you rich overnight. Consistent results come from learning, practice, and steady improvement.
Remember: trading involves risk. Never invest more than you can afford to lose, and have a clear risk-management plan. Do this well and you’ll find that gold trading isn’t just speculatio, it’s a disciplined craft worth mastering.
已编辑 29 Oct 2025, 16:46
风险提示:本文所述仅代表作者个人观点,不代表 Followme 的官方立场。Followme 不对内容的准确性、完整性或可靠性作出任何保证,对于基于该内容所采取的任何行为,不承担任何责任,除非另有书面明确说明。

暂无评论,立马抢沙发