Key Observations
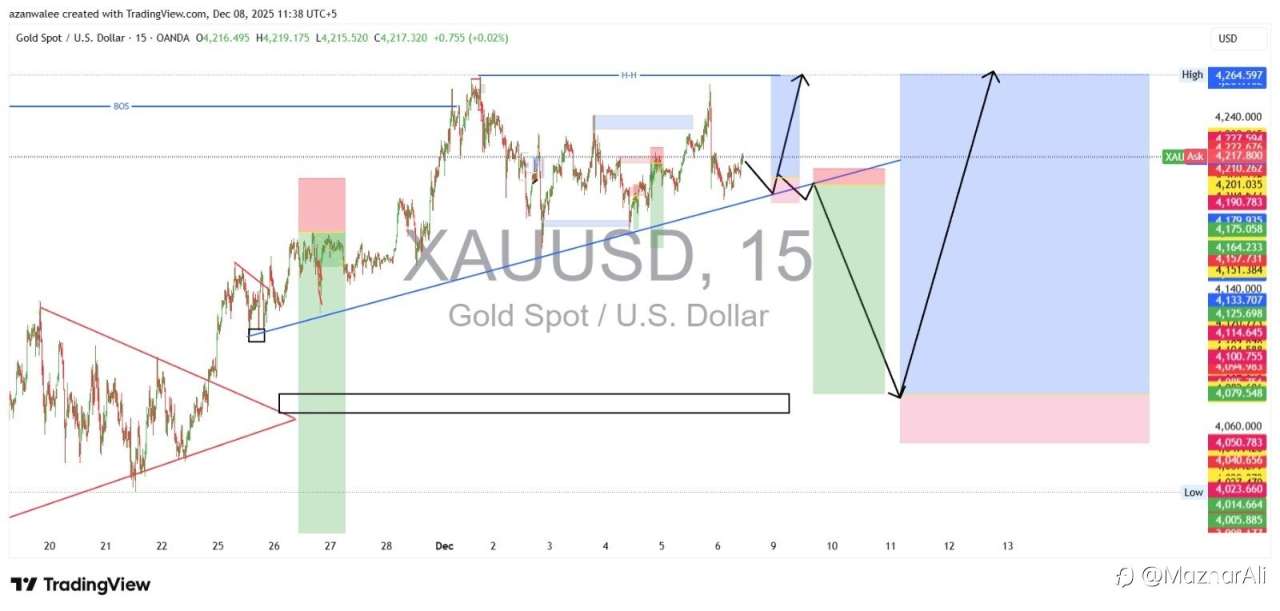
Higher High (HH): The market has established a significant Higher High (HH), indicating a prevailing bullish structure.
Break of Structure (BOS): There was a recent Break of Structure (BOS) to the upside, confirming the strength of the bullish momentum.
Ascending Trendline: Price is currently respecting and moving along an ascending trendline. This serves as a dynamic support level.
Current Price Action: Price is consolidating slightly below a recent swing high, showing indecision after the last upward movement.
💡 Potential Trade Setup: Short-Term Sell (Counter-Trend)
The most prominent pattern on the chart suggests a high-probability short-term selling opportunity based on the potential exhaustion of the current move and the presence of supply.
| Element | Description |
| Entry Zone (Supply) | The entry is set near the last resistance/swing high ($4,227 - $4,230$ area), which aligns with the potential break of the ascending trendline. |
| Stop Loss (S/L) | Placed above the most recent HH to protect against a continuation of the primary trend ($4,264$ area). |
| Take Profit (T/P) Zone | The target is a significant Demand Zone or Order Block much lower, identified by the large black box ($4,100 - $4,079$ area). This target represents a likely origin point for the next major leg up. |
| Trigger Condition | The trade is triggered upon a break and retest (or a clear rejection) of the ascending trendline and the failure to make a new higher high. |
Rationale for the Sell:
The structure anticipates a deep retracement into a strong demand zone before the main bullish trend can continue. Traders who believe the short-term structure is overextended may look for this counter-trend move.
🎯 Alternative Scenario: Continuation of Bullish Trend (Primary)
If the market maintains strength and the ascending trendline holds, the primary bullish outlook remains valid.
Bullish Entry: Look for a buy entry at the demand zone/order block immediately below the current consolidation area (the lower pink box/flag limit) or a bounce off the ascending trendline.
Target: A break of the current HH, aiming for a new swing high ($4,264$ and higher).
Disclaimer: This analysis is for educational purposes only and should not be considered financial advice. Trading foreign exchange and commodities involves significant risk, and you could lose your money.
风险提示:本文所述仅代表作者个人观点,不代表 Followme 的官方立场。Followme 不对内容的准确性、完整性或可靠性作出任何保证,对于基于该内容所采取的任何行为,不承担任何责任,除非另有书面明确说明。

暂无评论,立马抢沙发