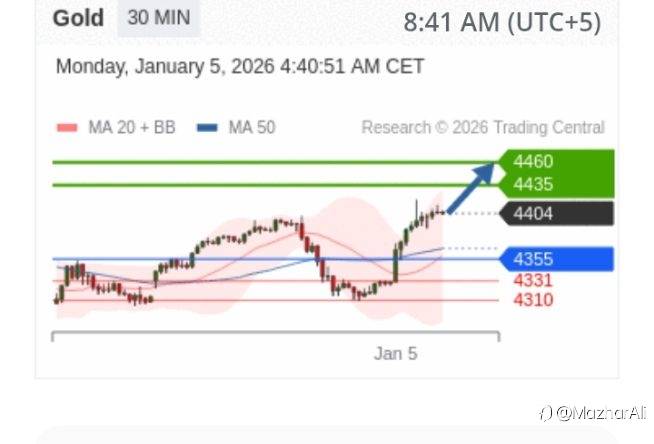
Date: January 5, 2026 | Time: 08:41 AM (UTC 5)
Current Price Action & Key Observations
Gold is currently trading near 4,404, positioned between the 20-period MA Bollinger Band and the 50-period MA, indicating a consolidation phase with a bullish bias. The price is holding above the critical pivot level of 4,355, reinforcing near-term strength.
Key Technical Levels
· Resistance:
1. 4,435 (Primary Target)
2. 4,460 (Extension Target)
· Pivot: 4,355 (Intraday Bias Level)
· Support:
1. 4,331 (Initial Support)
2. 4,310 (Secondary Support)
Indicator Analysis
· Moving Averages: Price above MA 50 suggests underlying bullish momentum. The MA 20 Bollinger Band provides dynamic resistance near current levels.
· RSI (Relative Strength Index): In bullish territory, supporting further upward movement.
· Price Structure: Higher lows formation above 4,355 aligns with the bullish intraday bias.
Trade Strategy
Primary Bias: Bullish
· Entry Zone: Long positions on pullbacks towards 4,355–4,360.
· Targets:
· First Target: 4,435
· Extended Target: 4,460
· Stop Loss: Below 4,331 (or 4,310 for wider risk management).
Alternative Scenario (If Pivot Breaks):
· A break below 4,355 could trigger a correction towards 4,331 and 4,310.
· Consider short positions only if price sustains below 4,355 with confirmation.
Market Context & Notes
· The analysis is based on a 30-minute timeframe, suitable for intraday trading.
· The bullish RSI and price holding above key moving averages suggest buyers remain in control.
· Monitor 4,355 closely—this level now acts as a decisive line between bullish continuation and a deeper pullback.
风险提示:本文所述仅代表作者个人观点,不代表 Followme 的官方立场。Followme 不对内容的准确性、完整性或可靠性作出任何保证,对于基于该内容所采取的任何行为,不承担任何责任,除非另有书面明确说明。

-THE END-