📈 Technical Analysis (Gold – XAU/USD)
Bullish Structure
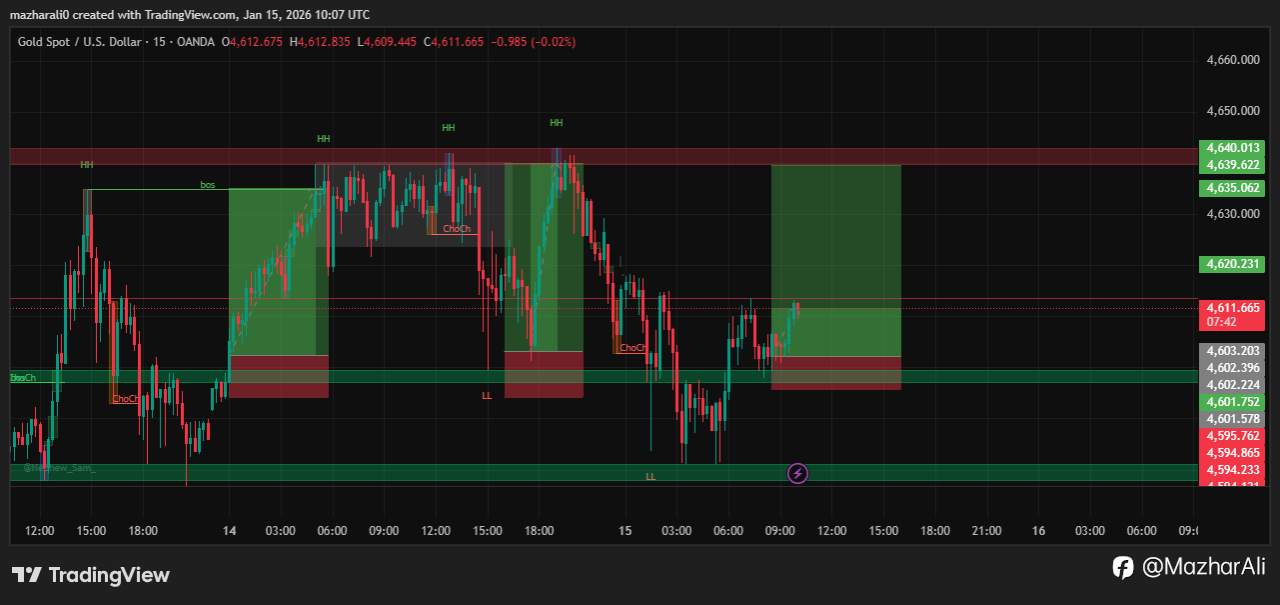
✅ Gold has been in a strong uptrend, with repeated higher highs and higher lows over recent months. Technical indicators (like moving averages) support this long-term bullish momentum. (The best social network for traders)
📌 Short-term behavior:
• Price is above key support zones and trendlines used by traders. (The best social network for traders)
• Momentum indicators (RSI and MACD) point to continued buying pressure, though overbought conditions can lead to consolidations/pullbacks before resumed strength. (The best social network for traders)
Key Technical Levels to Watch
📊 Support Zones:
• ~$4,200–$4,216 area — pivotal demand nearby. (The best social network for traders)
• ~$4,000 — major psychological and structural support. (EBC Financial Group)
📊 Resistance Zones:
• ~$4,500+ — major supply area that requires macro strength to break. (EBC Financial Group)
• Next potential pivot resistance reacting with volatility.
💡 Interpretation:
If price holds above support and maintains structure, bulls stay in control. A break below significant support could invite consolidation, but structure remains broadly constructive.
📊 Fundamental Analysis – What’s Driving Gold Now
1️⃣ Safe-Haven Demand
Gold continues to benefit from geopolitical and macro uncertainty. Recent surges beyond $4,600 per ounce highlight traders seeking safety amid global risk factors and political tensions. (Reuters)
2️⃣ Interest Rate Expectations & Real Yields
Gold is highly sensitive to real (inflation-adjusted) interest rates. Lower real yields — often driven by expectations of rate cuts or weaker economic data — support higher gold prices. (MEXC Blog)
3️⃣ Central Bank & Institutional Demand
Central banks (especially China) and gold ETFs continue buying aggressively, reducing available supply and boosting structural demand. (Reuters)
4️⃣ U.S. Dollar & Macro Relationships
Gold typically moves inversely to the USD — if the dollar weakens further, gold’s global purchasing appeal increases. (xauusd.gold)
5️⃣ Supply Considerations
Mining output is on track for record levels, but physical demand remains strong, helping underpin prices. (The Economic Times)
📌 Analyst Forecasts & Market Expectations
📍 HSBC & Citi project gold could reach $5,000/oz in 2026 amid continued risk-off sentiment. (Reuters)
📍 Others see strong demand keeping prices elevated, though corrections are possible if geopolitical tensions ease or rates remain higher than expected. (EBC Financial Group)
🧠 What This Means for Traders
🔥 Bullish Scenario:
• Price holds above key supports
• Fed signals rate cuts or weaker economic data
• Continued safe-haven flows → higher targets
📉 Bearish Scenario:
• Strong U.S. CPI/rates push yields up
• Dollar strengthens
• Profit-taking near resistance leads to pullbacks
✅ Summary
Gold retains structural strength both technically and fundamentally. The trend remains bullish as long as key support zones are respected and macro drivers support real yield pressure and safe-haven demand.
📊 Price behavior now is not random — it reflects deeper macro forces plus technical order flow patterns.
风险提示:本文所述仅代表作者个人观点,不代表 Followme 的官方立场。Followme 不对内容的准确性、完整性或可靠性作出任何保证,对于基于该内容所采取的任何行为,不承担任何责任,除非另有书面明确说明。

-THE END-