-
EUR/NZD made a strong bullish bounce at the 50% Fibonacci retracement level. The bullish breakout above the resistance trend lines (dotted orange) indicates more upside.
-
This article will review the EUR/NZD price patterns and targets, but also why this particular currency pair offers the best charting opportunities this week.
-
The Euro seems posed to be one of the strongest currencies this week with impressive gains against the USD, GBP, and AUD while keeping in balance with the JPY.
Price charts and technical analysis
The Euro seems posed to be one of the strongest currencies this week with impressive gains against the USD, GBP, and AUD while keeping in balance with the JPY.
On the other hand, the NZDis mostly on the losing end versus the USD and AUD. With EUR strength and NZD weakness, the EUR/NZD seems ready for more upside:
-
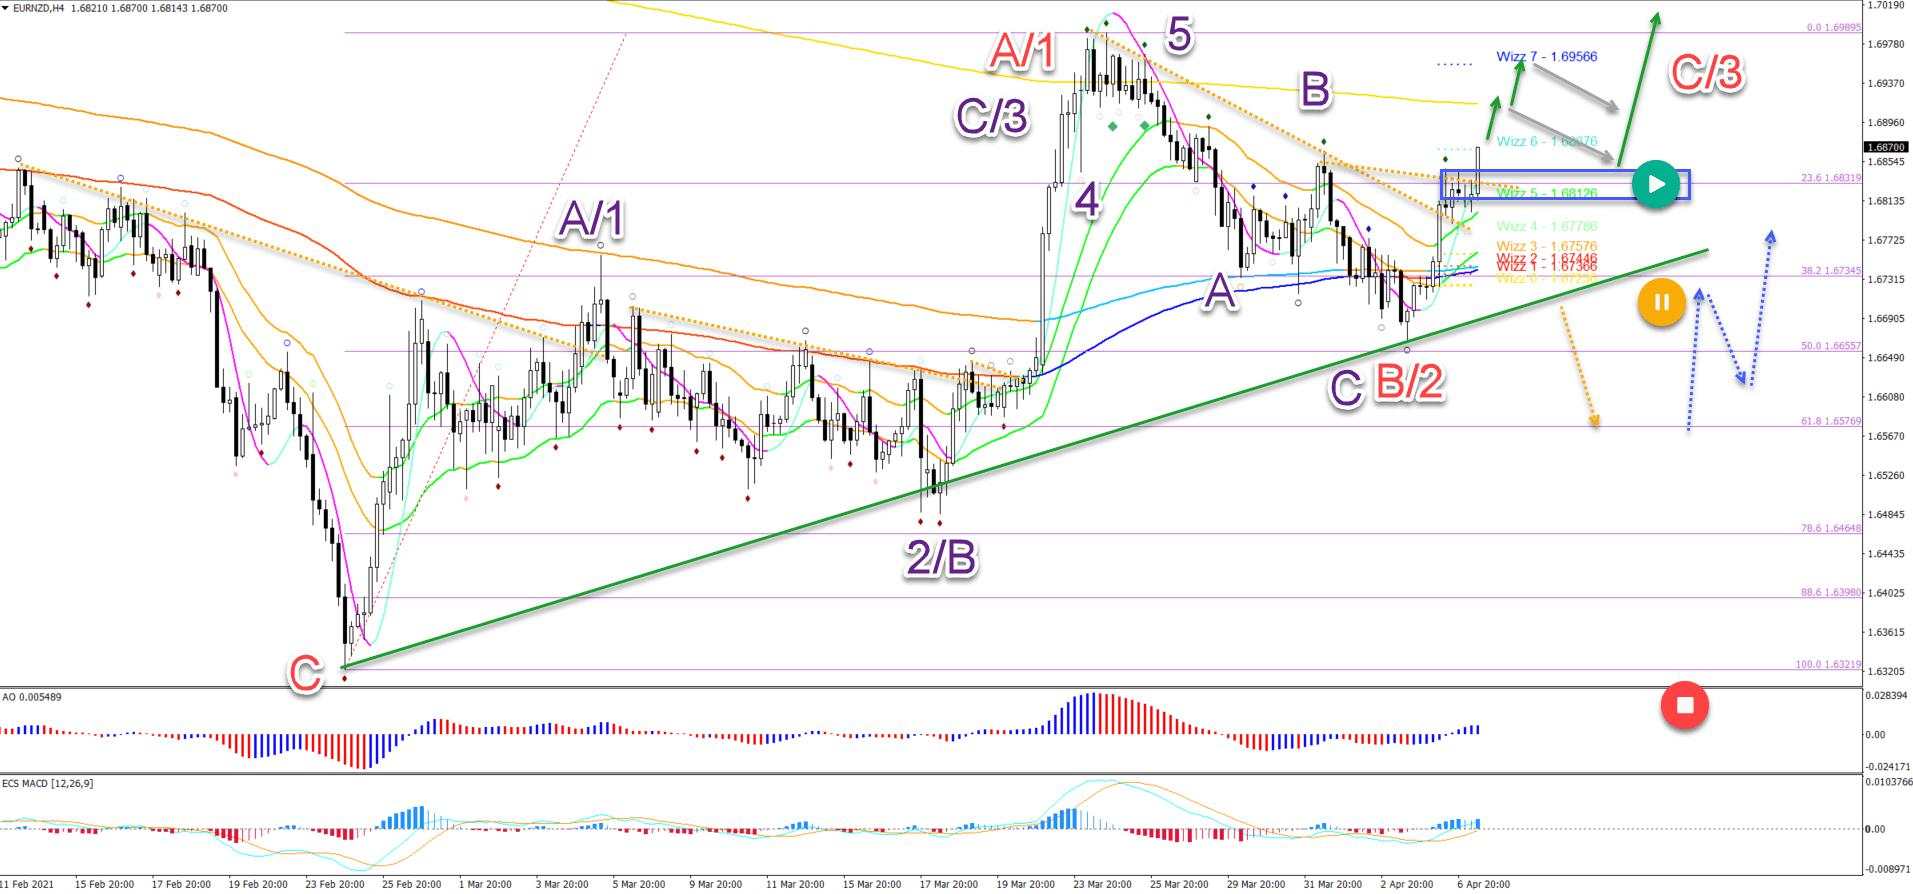
The EUR/NZD chart itself seems to have completed an ABC (purple) correction at the 50% Fibonacci support level.
-
The larger picture remains unclear, whether price action is building an ABC or 123 (red)... But in both wave scenarios, more upside seems likely.
-
The strong breakout followed by a push above the Fractal resistance is confirming a push higher.
-
The intermediate main target is the 610 ema followed by the WIzz 7 level. These levels could create a bull flag chart pattern (grey arrows).
-
A bullish breakout above the flag patterns should send the pair higher. The main targets are located at 1.70, 1.71 and 1.7170.
-
Price remains in an uptrend as long as it stays above the support zone (blue box). A break below the support trend line (green) indicates a deeper retracement (dotted orange lines) towards the 31.8% Fibonacci level.
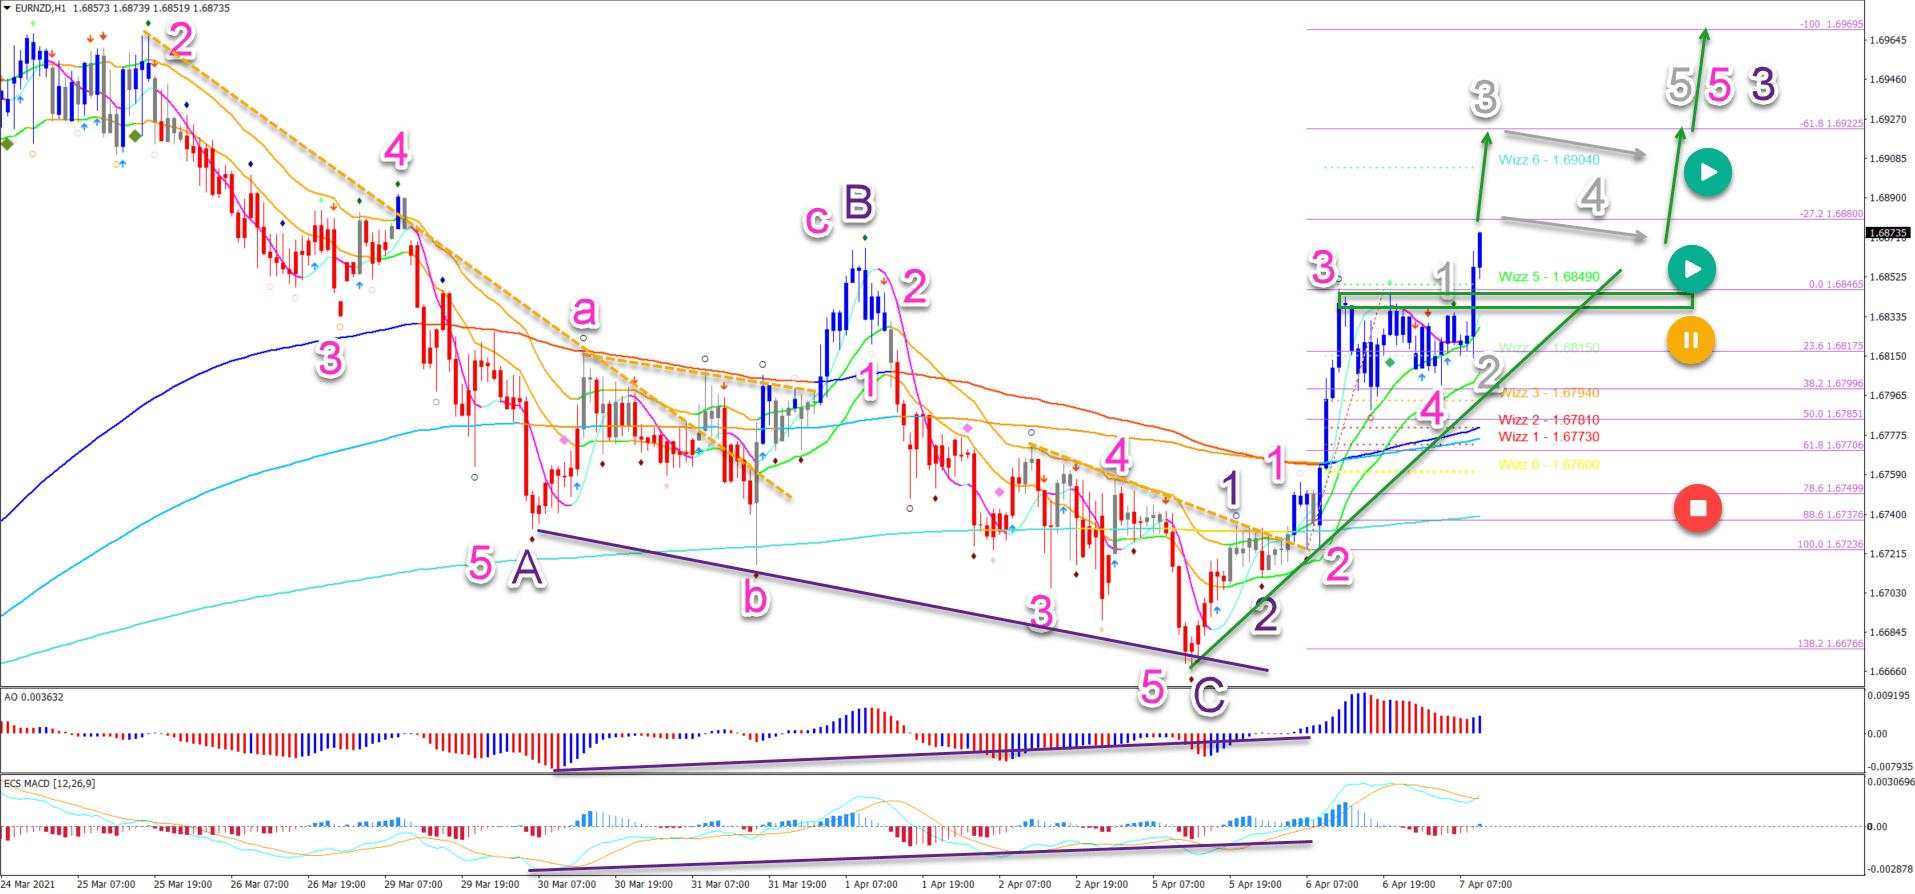
On the 1 hour chart, the bears have lost control and the bulls seem posed to push price up higher soon:
-
The divergence pattern between the lows (purple line) has confirmed a reversal.
-
Price action has broken above the long-term moving averages.
-
The price action is showing strong momentum to the upside.
-
A corrective pattern respected the 38.2% Fibonacci level and bounced back up.
-
The corrective pattern saw a bullish breakout.
The bulls could push immediately higher. This offers potential on intra-day or intra-week time frames for more upside.
Eventually a retracement is expected. A bull flag pattern (grey arrows) followed by a breakout could indicate more upside.
The analysis has been done with the ecs.SWAT method and ebook.
作者:Chris Svorcik,文章来源FXStreet,版权归原作者所有,如有侵权请联系本人删除。
风险提示:本文所述仅代表作者个人观点,不代表 Followme 的官方立场。Followme 不对内容的准确性、完整性或可靠性作出任何保证,对于基于该内容所采取的任何行为,不承担任何责任,除非另有书面明确说明。

暂无评论,立马抢沙发