-
The XAU/USD chart was unable to break above the resistance trend line (orange) and is now testing the support trend line (green).
-
Price action seems to be building 3 corrective waves down after 5 impulsive waves up. Now an ABC zigzag pattern seems to be taking place in wave 2 or B.
-
The target is the previous top. A break below the 100% Fib places the bullish ABC or 123 (pink) on hold (orange sign).
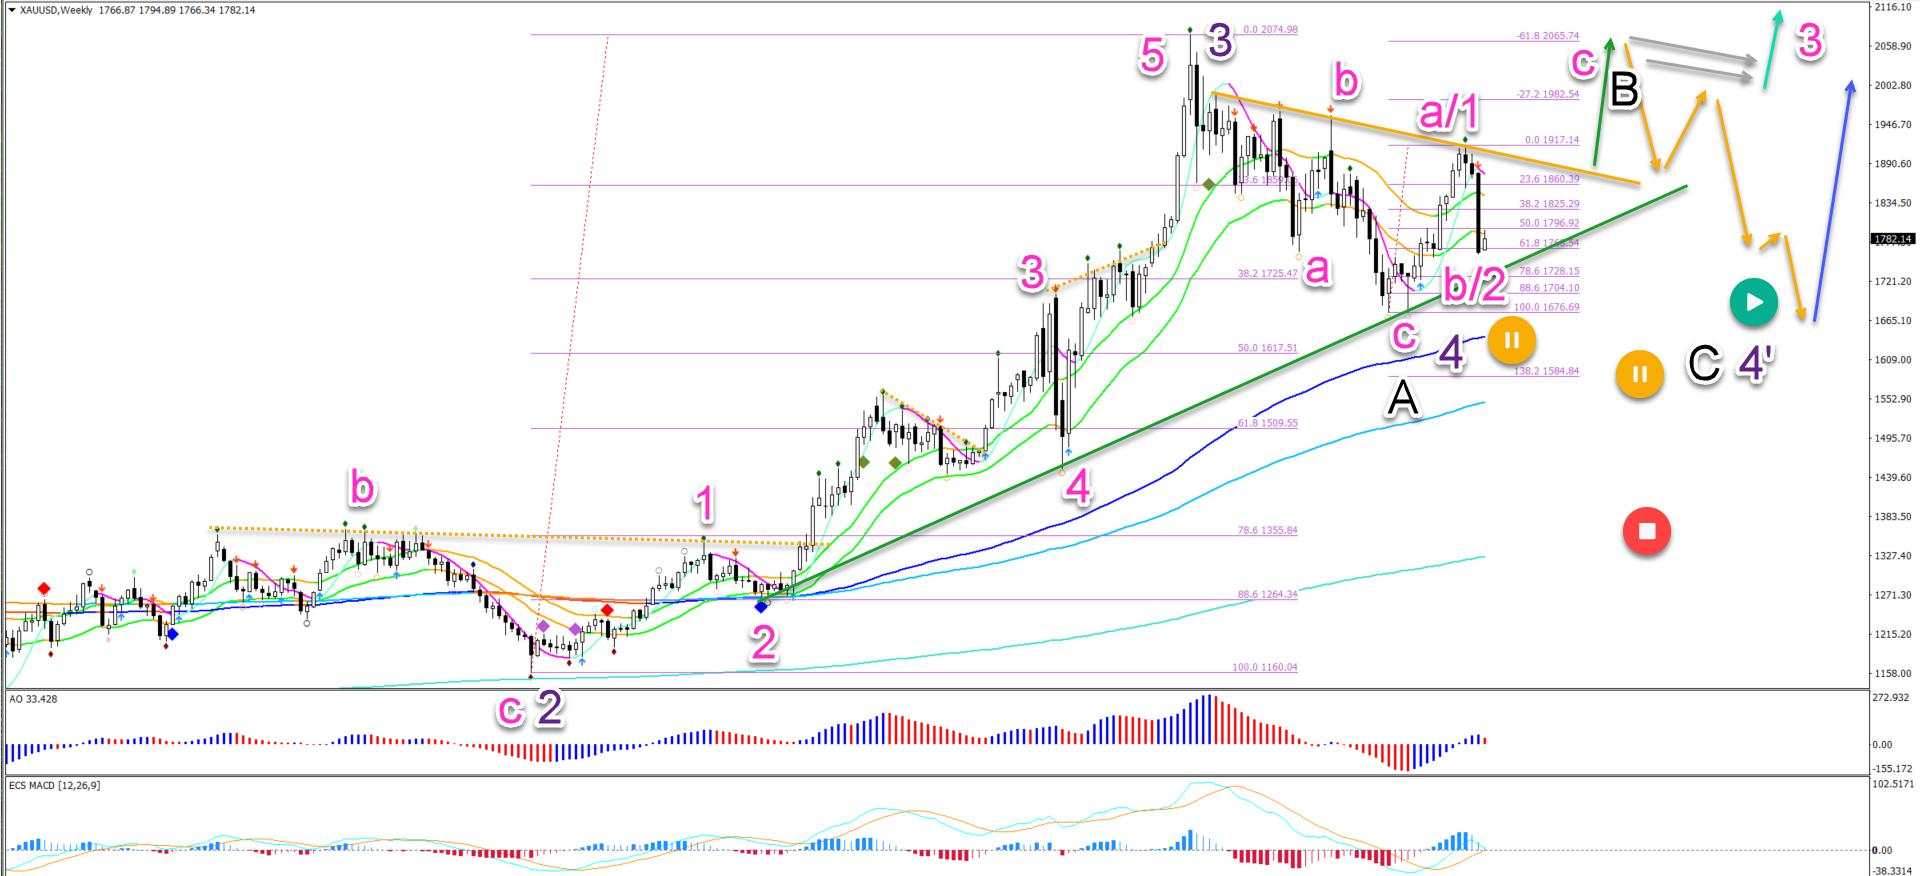
The XAU/USD (Gold) weekly chart made a bearish reversal contrary to our previous analysis. This indicates that price action has either completed a wave 1 or A (pink).
This article analyzes what to expect from the wave 4 retracement (purple).
Price charts and technical analysis
The XAU/USD chart was unable to break above the resistance trend line (orange) and is now testing the support trend line (green):
-
A bullish bounce at the support line (green) and 61.8%, 78.6% or 88.6% Fibonacci retracement levels of the wave B/2 (pink) could confirm one more bullish swing.
-
The target is the previous top. A break below the 100% Fib places the bullish ABC or 123 (pink) on hold (orange sign).
-
If price action gets close to the previous top, then the price reaction will be very important.
-
A bull flag (grey arrows) pattern could indicate more uptrend (aqua blue arrow).
-
A bearish reversal (orange arrows) could indicate a bearish ABC (black) pattern in wave 4’ (purple).
-
Any deeper retracement places the uptrend on hold (orange and red signs).
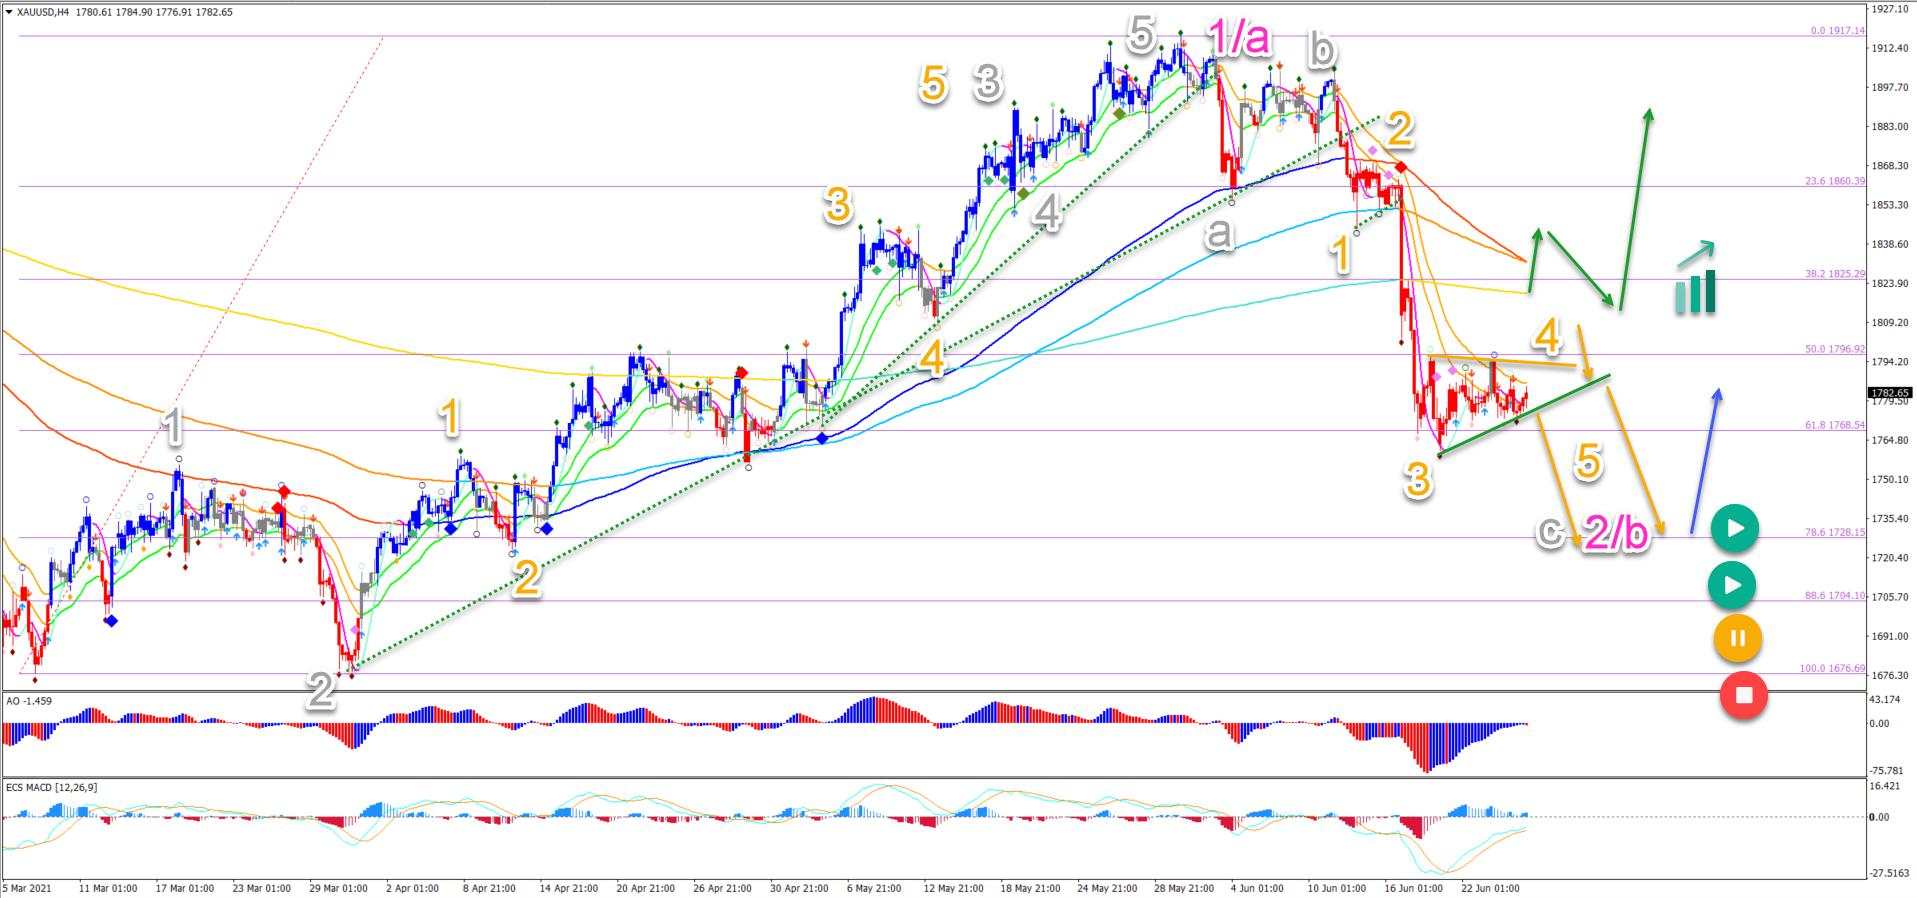
On the 4 hour chart, price action seems to be building 3 corrective waves down after 5 impulsive waves up:
-
The 5 bullish waves (grey) completed a wave 1 or A (pink).
-
Now an ABC (grey) zigzag pattern seems to be taking place in wave 2 or B (pink).
-
A bearish breakout (orange arrows) below the support line (green) could aim at the 78.6% Fibonacci level.
-
A bullish bounce (blue arrow) at the deep Fibonacci retracement levels is expected.
-
A bullish breakout above the long-term moving averages could indicate the end of the bearish ABC (grey) as well and the start of a bullish price swing.
The analysis has been done with the ecs.SWAT method and ebook.
作者:Chris Svorcik,文章来源FXStreet,版权归原作者所有,如有侵权请联系本人删除。
风险提示:本文所述仅代表作者个人观点,不代表 Followme 的官方立场。Followme 不对内容的准确性、完整性或可靠性作出任何保证,对于基于该内容所采取的任何行为,不承担任何责任,除非另有书面明确说明。

暂无评论,立马抢沙发