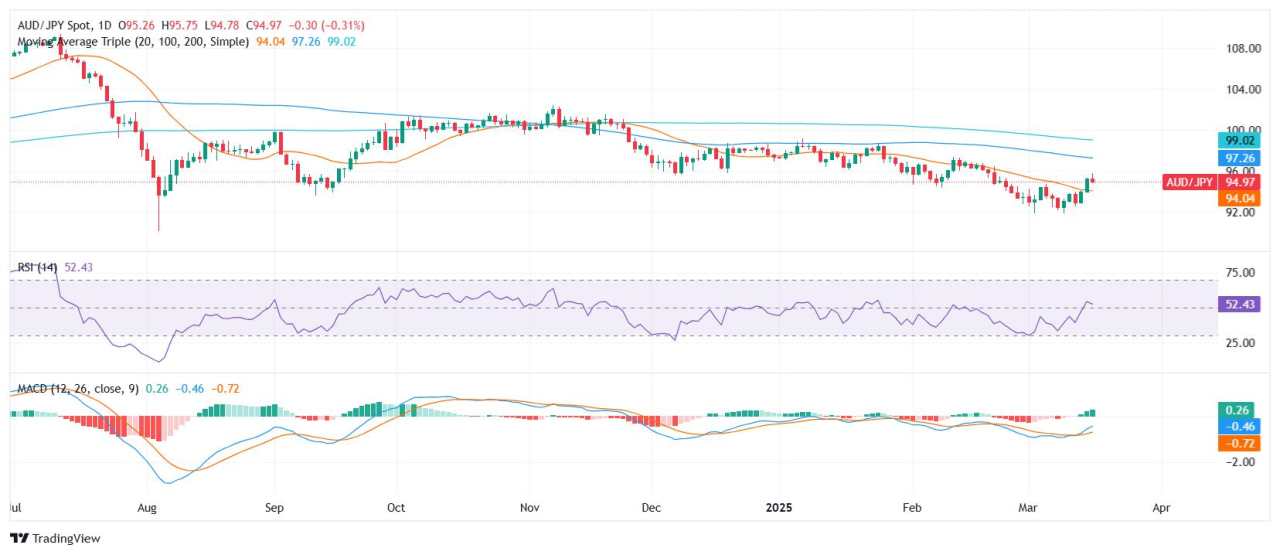
- AUD/JPY was seen trading around the 95.00 area ahead of the Asian session, posting a slight decline.
- After failing to sustain gains near 96.00, the pair retreated but remains above the 20-day SMA, keeping the outlook positive.
- Traders should monitor if the RSI crosses below 50, which could indicate a shift in momentum.
AUD/JPY edged lower on Tuesday ahead of the Asian session, retreating below 95.00 after hitting resistance near the 96.00 zone. Despite the pullback, the pair still holds above its 20-day Simple Moving Average (SMA), keeping the broader trend tilted to the upside.
Technically, the Relative Strength Index (RSI) has declined sharply but remains in positive territory at 54. A drop below the 50 mark could signal a potential shift in sentiment. Meanwhile, the Moving Average Convergence Divergence (MACD) continues to print rising green bars, suggesting that bullish momentum remains in place for now.
Looking ahead, immediate support lies at the 20-day SMA, while stronger demand may emerge near 94.50. On the upside, resistance is seen around 96.00, where sellers have consistently capped gains. If the pair manages to reclaim this level, further upside toward 97.00 could be in play.
AUD/JPY daily chart
作者:Patricio Martín,文章来源FXStreet,版权归原作者所有,如有侵权请联系本人删除。
风险提示:本文所述仅代表作者个人观点,不代表 Followme 的官方立场。Followme 不对内容的准确性、完整性或可靠性作出任何保证,对于基于该内容所采取的任何行为,不承担任何责任,除非另有书面明确说明。

暂无评论,立马抢沙发