- NZD/USD fell toward the 0.5550 zone on Monday, extending its losing streak ahead of the Asian session.
- The pair is weighed by persistent bearish signals, despite some neutral momentum readings.
- Key resistance sits near the 0.5700 area, with all major moving averages reinforcing downside pressure.
The NZD/USD pair continued its slide on Monday ahead of the Asian session, with the Kiwi dipping toward the 0.5550 area. The bearish tone dominated as the pair lost ground within the broader range between 0.5551 and 0.5798, extending a recent decline that aligns with the weakening technical landscape.
Daily chart
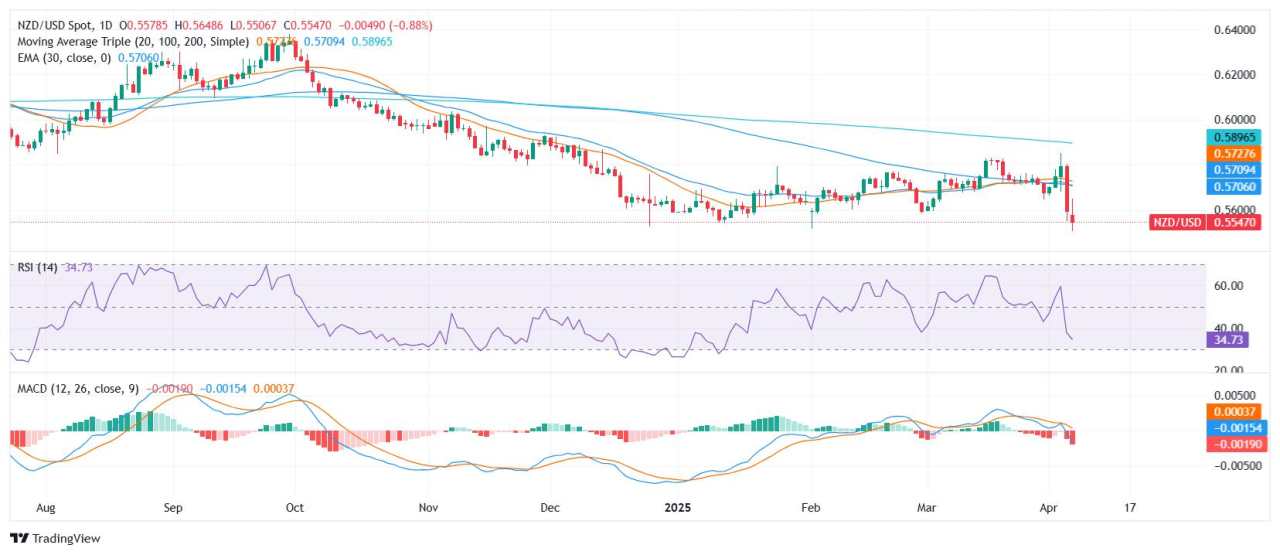
From a technical standpoint, the setup leans decisively bearish. The Moving Average Convergence Divergence (MACD) prints a sell signal, while the Relative Strength Index (RSI) stands bearish at 38.01 while other momentum indicators, such as the Stochastic %K at 46.20 and Commodity Channel Index (CCI) at -191.51, flash neutral readings, but reflect oversold bias nearing breakdown thresholds.
The bearish momentum is supported by moving averages. The 20-day Simple Moving Average (SMA) at 0.57348, 100-day at 0.57179, and 200-day at 0.59039 are all sloping downward, signaling sustained pressure. In addition, the 10-day Exponential Moving Average (EMA) and SMA, both near 0.5712, also cap the upside.
作者:Patricio Martín,文章来源FXStreet_id,版权归原作者所有,如有侵权请联系本人删除。
风险提示:本文所述仅代表作者个人观点,不代表 Followme 的官方立场。Followme 不对内容的准确性、完整性或可靠性作出任何保证,对于基于该内容所采取的任何行为,不承担任何责任,除非另有书面明确说明。


加载失败()