- AUD/JPY trades near the 87.00 zone after falling heavily during Tuesday’s session.
- Momentum remains bearish as sellers dominate, with price near the lower end of its daily range.
- Resistance stands around the 87.48 to 91.24 zone, while longer-term moving averages reinforce the downtrend.
The AUD/JPY pair extended its losses on Tuesday, trading near the 87.00 area ahead of the Asian session. The cross has dropped significantly on the day, falling near the bottom of its daily range, reflecting persistent downside pressure. The move has come alongside weakening short-term momentum indicators and a broader bearish structure confirmed by long-term trend signals.
Daily chart
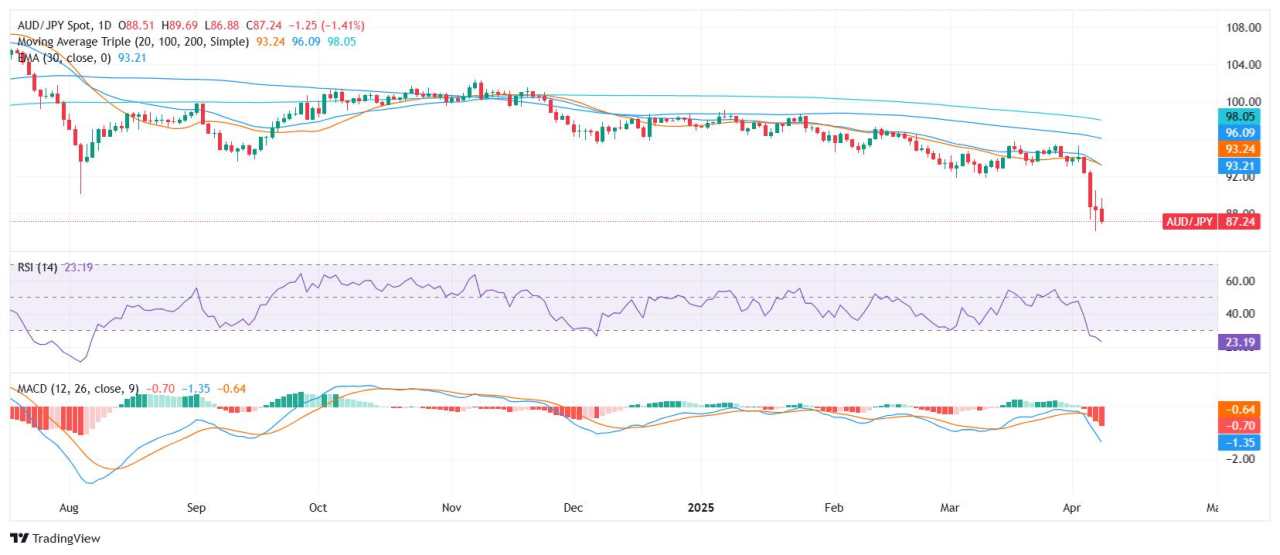
From a technical standpoint, the Relative Strength Index (RSI) sits at 22.24, entering oversold territory but not yet reversing, which suggests bearish momentum remains in place. The Moving Average Convergence Divergence (MACD) prints a sell signal, in line with the broader trend. Meanwhile, both the Bull Bear Power indicator (−6.794) and Stochastic %K (17.85) are showing neutral signals, signaling no immediate shift in direction.
Reinforcing the negative sentiment, all key moving averages continue to flash sell signals. The 10-day Exponential Moving Average (EMA) at 91.24 and 10-day Simple Moving Average (SMA) at 92.28 sit far above current price action. Similarly, the 20-day SMA (93.24), 100-day SMA (96.17), and 200-day SMA (98.16) maintain their downward slope, confirming the dominant bearish outlook.
作者:Patricio Martín,文章来源FXStreet_id,版权归原作者所有,如有侵权请联系本人删除。
风险提示:本文所述仅代表作者个人观点,不代表 Followme 的官方立场。Followme 不对内容的准确性、完整性或可靠性作出任何保证,对于基于该内容所采取的任何行为,不承担任何责任,除非另有书面明确说明。

暂无评论,立马抢沙发