- USD/CAD may find support near the six-month low of 1.3828, recorded on Monday.
- The 14-day RSI indicates oversold conditions, pointing to the possibility of a short-term rebound.
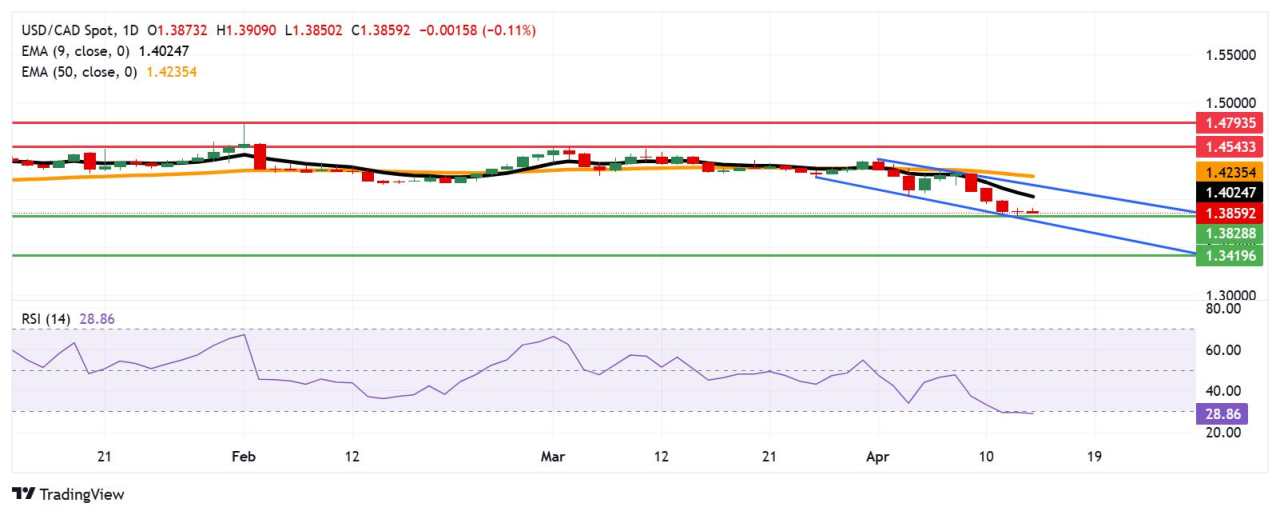
- Initial resistance is positioned at the nine-day EMA around 1.4025, followed by the descending channel’s upper boundary.
The USD/CAD pair extends its decline for the fifth consecutive session, hovering around 1.3860 during European trading on Tuesday. Daily chart technical analysis highlights a dominant bearish trend, with the pair trending lower within a descending channel formation.
Additionally, the USD/CAD pair remains below the nine-day Exponential Moving Average (EMA), signaling weak short-term price momentum. Meanwhile, the 14-day Relative Strength Index (RSI) stays below the 30 level, suggesting the bearish bias is in play but also indicating oversold conditions. This opens the door for potential short-term corrective rebounds.
On the downside, USD/CAD may retest the six-month low of 1.3828, marked on Monday, which coincides with the lower boundary of the descending channel near the 1.3770 level. A decisive break below this channel could reinforce the bearish bias and pave the way for a move toward the 1.3419 area — its lowest point since February 2024.
Initial resistance is seen at the nine-day EMA around 1.4025, followed by the upper boundary of the descending channel near 1.4150. A breakout above this channel could shift the bias to bullish, potentially driving the USD/CAD pair toward the 50-day EMA at 1.4230. Beyond that, further resistance is located at the two-month high of 1.4543, set on March 4.
USD/CAD: Daily Chart
Canadian Dollar PRICE Today
The table below shows the percentage change of Canadian Dollar (CAD) against listed major currencies today. Canadian Dollar was the weakest against the New Zealand Dollar.
| USD | EUR | GBP | JPY | CAD | AUD | NZD | CHF | |
|---|---|---|---|---|---|---|---|---|
| USD | -0.00% | -0.32% | -0.17% | -0.14% | -0.46% | -0.53% | -0.10% | |
| EUR | 0.00% | -0.31% | -0.16% | -0.12% | -0.40% | -0.52% | -0.08% | |
| GBP | 0.32% | 0.31% | 0.19% | 0.19% | -0.07% | -0.21% | 0.24% | |
| JPY | 0.17% | 0.16% | -0.19% | 0.02% | -0.27% | -0.51% | 0.05% | |
| CAD | 0.14% | 0.12% | -0.19% | -0.02% | -0.29% | -0.40% | 0.05% | |
| AUD | 0.46% | 0.40% | 0.07% | 0.27% | 0.29% | -0.14% | 0.32% | |
| NZD | 0.53% | 0.52% | 0.21% | 0.51% | 0.40% | 0.14% | 0.45% | |
| CHF | 0.10% | 0.08% | -0.24% | -0.05% | -0.05% | -0.32% | -0.45% |
The heat map shows percentage changes of major currencies against each other. The base currency is picked from the left column, while the quote currency is picked from the top row. For example, if you pick the Canadian Dollar from the left column and move along the horizontal line to the US Dollar, the percentage change displayed in the box will represent CAD (base)/USD (quote).
作者:Akhtar Faruqui,文章来源FXStreet_id,版权归原作者所有,如有侵权请联系本人删除。
风险提示:本文所述仅代表作者个人观点,不代表 Followme 的官方立场。Followme 不对内容的准确性、完整性或可靠性作出任何保证,对于基于该内容所采取的任何行为,不承担任何责任,除非另有书面明确说明。

暂无评论,立马抢沙发