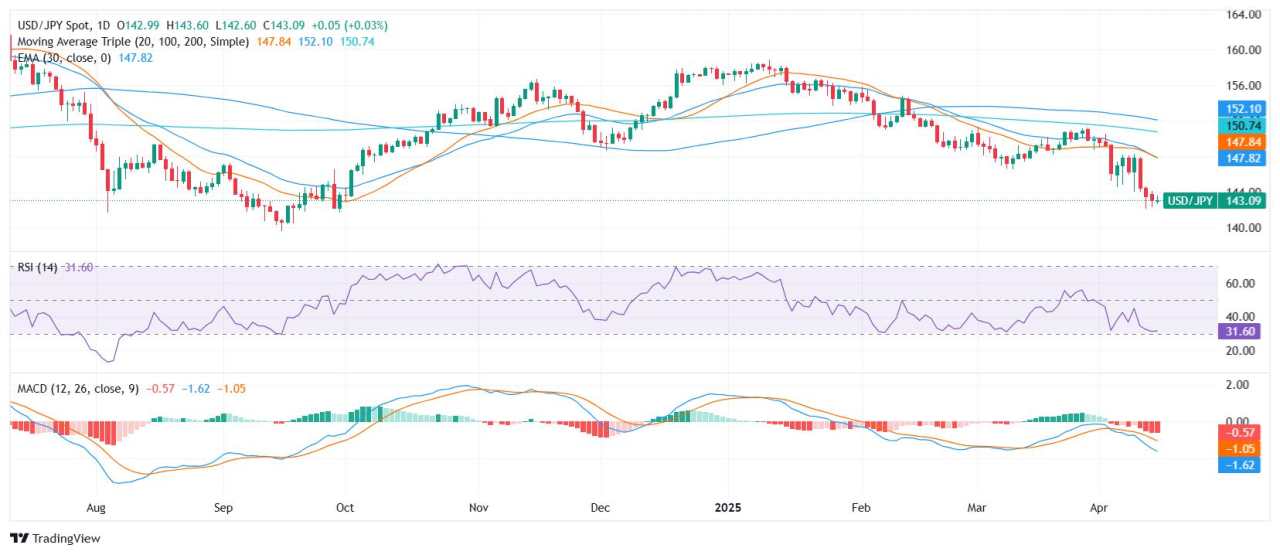
- USD/JPY trades near the 143 zone, extending mild gains ahead of the Asian session
- Despite the uptick, technical indicators and moving averages continue to reflect a bearish structure
- Support sits at 142.41, while resistance levels cap gains near 145.79 and 146.62
The USD/JPY pair saw a slight rise on Tuesday, hovering around the 143 area as it edged higher within its daily range. The modest intraday rebound comes ahead of the Asian session but has yet to challenge the broader bearish signals dominating the chart.
Technical indicators remain conflicted. The Relative Strength Index is neutral at 32.19, holding near the lower bound without triggering oversold conditions. Meanwhile, the MACD continues to print a bearish crossover, reinforcing downside pressure. A contrasting view comes from the Williams Percent Range at -88.24, which suggests the pair may be oversold in the short term and due for a bounce. The Ultimate Oscillator at 52.72 remains neutral, offering no clear bias.
The dominant trend remains negative, especially when analyzing moving averages. The 10-day exponential and simple moving averages at 145.47 and 145.79, respectively, cap near-term upside. Longer-term averages—20-day at 147.81, 100-day at 152.02, and 200-day at 150.77—continue to slope downward, affirming persistent selling pressure.
Daily chart
作者:Patricio Martín,文章来源FXStreet_id,版权归原作者所有,如有侵权请联系本人删除。
风险提示:本文所述仅代表作者个人观点,不代表 Followme 的官方立场。Followme 不对内容的准确性、完整性或可靠性作出任何保证,对于基于该内容所采取的任何行为,不承担任何责任,除非另有书面明确说明。


加载失败()