- USD/JPY could retest the seven-month low of 141.61, recorded on Thursday.
- If the 14-day Relative Strength Index falls below the 30 level, it could potentially trigger a short-term corrective rebound.
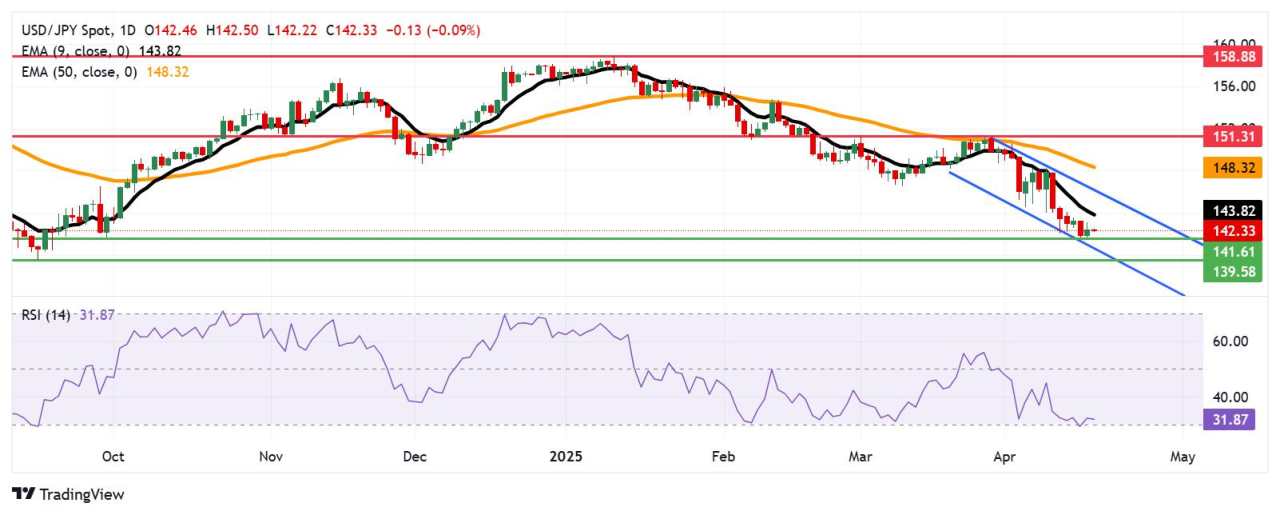
- The primary initial resistance is located near the nine-day EMA at 143.80.
USD/JPY inches lower after registering gains in the previous session, trading around 142.40 during the Asian session on Friday. An analysis of the daily chart showed the pair moves downward within a descending channel, indicating a confirmed bearish bias.
The USD/JPY pair continues to trade below the nine-day Exponential Moving Average (EMA), signaling subdued short-term momentum. Meanwhile, the 14-day Relative Strength Index (RSI) hovers just above the 30 level, further supporting the ongoing bearish outlook. A drop below the 30 mark could suggest an oversold condition, potentially triggering a short-term corrective rebound.
On the downside, the USD/JPY pair may revisit the seven-month low of 141.61, marked on Thursday, followed by the descending channel’s lower boundary near 140.80. A decisive break below this channel could reinforce the bearish bias and open the door for a move toward 139.58 — the lowest level since July 2023, last seen in September 2024.
To the upside, initial resistance is seen at the nine-day EMA around 143.80. A breakout above this level could boost short-term momentum and pave the way for a test of the descending channel’s upper boundary near 146.30.
Further resistance is located at the 50-day EMA at 148.30, followed by the two-month high of 151.31, recorded on March 3.
USD/JPY: Daily Chart
Japanese Yen PRICE Today
The table below shows the percentage change of Japanese Yen (JPY) against listed major currencies today. Japanese Yen was the weakest against the Swiss Franc.
| USD | EUR | GBP | JPY | CAD | AUD | NZD | CHF | |
|---|---|---|---|---|---|---|---|---|
| USD | -0.10% | -0.04% | 0.00% | 0.00% | 0.13% | 0.00% | 0.00% | |
| EUR | 0.10% | 0.00% | 0.00% | 0.00% | 0.00% | 0.00% | 0.00% | |
| GBP | 0.04% | 0.00% | 0.00% | 0.00% | 0.00% | 0.00% | 0.00% | |
| JPY | 0.00% | 0.00% | 0.00% | 0.00% | 0.24% | 0.53% | -0.06% | |
| CAD | 0.00% | 0.00% | 0.00% | 0.00% | -0.02% | 0.00% | 0.00% | |
| AUD | -0.13% | 0.00% | 0.00% | -0.24% | 0.02% | 0.00% | 0.00% | |
| NZD | 0.00% | 0.00% | 0.00% | -0.53% | 0.00% | 0.00% | 0.00% | |
| CHF | 0.00% | 0.00% | 0.00% | 0.06% | 0.00% | 0.00% | 0.00% |
The heat map shows percentage changes of major currencies against each other. The base currency is picked from the left column, while the quote currency is picked from the top row. For example, if you pick the Japanese Yen from the left column and move along the horizontal line to the US Dollar, the percentage change displayed in the box will represent JPY (base)/USD (quote).
作者:Akhtar Faruqui,文章来源FXStreet_id,版权归原作者所有,如有侵权请联系本人删除。
风险提示:本文所述仅代表作者个人观点,不代表 Followme 的官方立场。Followme 不对内容的准确性、完整性或可靠性作出任何保证,对于基于该内容所采取的任何行为,不承担任何责任,除非另有书面明确说明。


加载失败()