- GBP/USD could encounter primary resistance at the psychological level of 1.3400
- The 14-day RSI moves above 70, suggesting a potential downside correction may be on the horizon.
- The immediate support lies at the nine-day EMA, near 1.3194, followed by the ascending channel’s lower boundary around 1.3150.
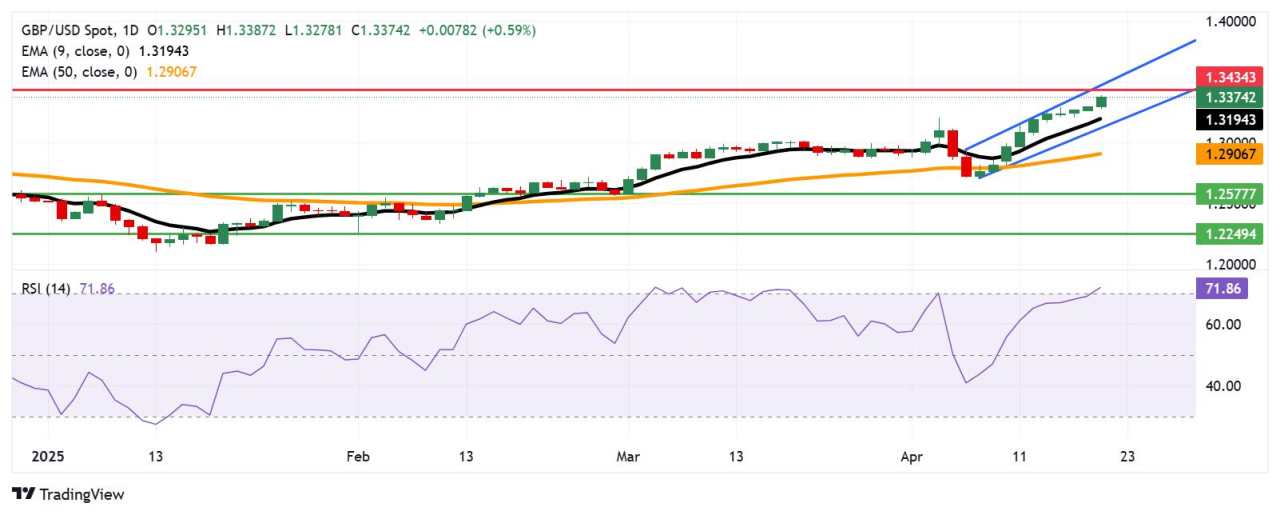
The GBP/USD pair continues its winning streak that began on April 8, trading around 1.3370 during the Asian hours on Monday. Daily chart technical analysis points to a continued bullish trend, with the pair advancing within an ascending channel pattern.
Additionally, the GBP/USD pair continues to trade above the nine-day Exponential Moving Average (EMA), reinforcing the short-term bullish momentum. However, the 14-day Relative Strength Index (RSI) has climbed above 70, indicating overbought conditions and suggesting a potential downside correction may be on the horizon.
The GBP/USD pair encounters initial resistance at the psychological level of 1.3400, followed by 1.3434 — a level not seen since September 2024 and the lowest since March 2022. A sustained move higher could reinforce the bullish bias, with the pair potentially targeting the ascending channel’s upper boundary near 1.3480.
On the downside, immediate support is seen at the nine-day EMA, around 1.3194, followed by the ascending channel’s lower boundary near 1.3150. A break below this crucial area could undermine short-term bullish momentum, with the 50-day EMA at 1.2906 emerging as the next significant support level.
A deeper decline below this level could dent the medium-term bullish outlook, potentially driving the GBP/USD pair toward the two-month low of 1.2577, recorded on March 3, and further down to the three-month low of 1.2249, registered on February 3.
GBP/USD: Daily Chart
British Pound PRICE Today
The table below shows the percentage change of British Pound (GBP) against listed major currencies today. British Pound was the strongest against the US Dollar.
| USD | EUR | GBP | JPY | CAD | AUD | NZD | CHF | |
|---|---|---|---|---|---|---|---|---|
| USD | -1.03% | -0.63% | -0.86% | -0.36% | -0.51% | -1.04% | -0.96% | |
| EUR | 1.03% | 0.25% | 0.15% | 0.63% | 0.33% | -0.04% | 0.05% | |
| GBP | 0.63% | -0.25% | 0.08% | 0.40% | 0.08% | -0.29% | -0.20% | |
| JPY | 0.86% | -0.15% | -0.08% | 0.50% | 0.21% | -0.07% | -0.07% | |
| CAD | 0.36% | -0.63% | -0.40% | -0.50% | -0.27% | -0.68% | -0.58% | |
| AUD | 0.51% | -0.33% | -0.08% | -0.21% | 0.27% | -0.36% | -0.28% | |
| NZD | 1.04% | 0.04% | 0.29% | 0.07% | 0.68% | 0.36% | 0.12% | |
| CHF | 0.96% | -0.05% | 0.20% | 0.07% | 0.58% | 0.28% | -0.12% |
The heat map shows percentage changes of major currencies against each other. The base currency is picked from the left column, while the quote currency is picked from the top row. For example, if you pick the British Pound from the left column and move along the horizontal line to the US Dollar, the percentage change displayed in the box will represent GBP (base)/USD (quote).
作者:Akhtar Faruqui,文章来源FXStreet_id,版权归原作者所有,如有侵权请联系本人删除。
风险提示:本文所述仅代表作者个人观点,不代表 Followme 的官方立场。Followme 不对内容的准确性、完整性或可靠性作出任何保证,对于基于该内容所采取的任何行为,不承担任何责任,除非另有书面明确说明。


加载失败()