- AUD/JPY trades near the 90.10 area after easing modestly ahead of the Asian session.
- Momentum indicators are mixed, but moving averages continue to align with bearish pressure.
- Resistance is seen at 90.49, 90.50, and 90.57, while downside risk builds below the 90.00 handle.
The AUDJPY pair is flashing an overall bearish signal, currently trading around 90.10 after a modest dip during Tuesday’s session. The cross remains mid-range between the day’s low of 89.64 and high of 90.58, suggesting hesitation in either direction as markets await fresh momentum into Asia.
From a technical perspective, short-term indicators show a mixed picture. The Relative Strength Index (RSI) holds neutral near the 42 level, while the MACD is beginning to flash a buy signal. Complementing the indecisiveness, both the Stochastic %K and the Commodity Channel Index (CCI) remain in neutral territory, suggesting consolidation rather than trend continuation in the near term.
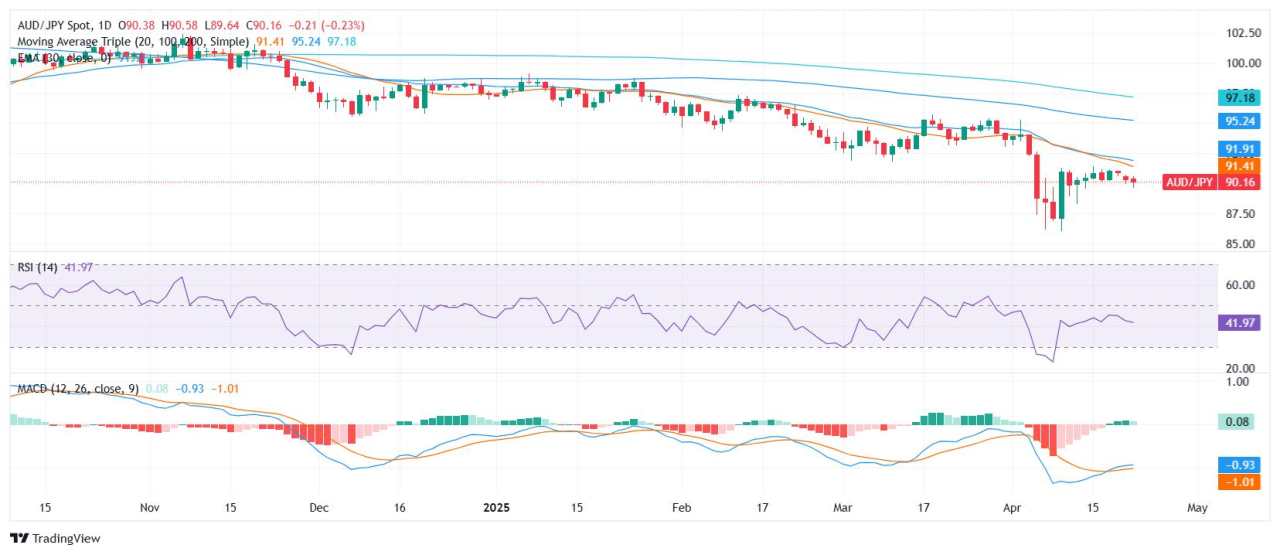
Despite the muted momentum, broader trend signals continue to lean bearish. The 20-day, 100-day, and 200-day Simple Moving Averages (SMAs), all located above 91.00, confirm prevailing downside bias. The 10-day EMA and SMA, sitting just above the current price at 90.57 and 90.50 respectively, add immediate resistance.
Traders may look to resistance levels at 90.49, 90.50, and 90.57 should any bullish correction emerge. However, the overall tone remains cautious, with sellers likely to retain control if the pair remains capped below the 91.00 region.
AUD/JPY daily chart
作者:Patricio Martín,文章来源FXStreet,版权归原作者所有,如有侵权请联系本人删除。
风险提示:以上内容仅代表作者或嘉宾的观点,不代表 FOLLOWME 的任何观点及立场,且不代表 FOLLOWME 同意其说法或描述,也不构成任何投资建议。对于访问者根据 FOLLOWME 社区提供的信息所做出的一切行为,除非另有明确的书面承诺文件,否则本社区不承担任何形式的责任。
FOLLOWME 交易社区网址: www.followme.ceo


加载失败()