- The US Dollar Index may retest the psychological support at 99.00, followed by 97.91, its lowest point since March 2022.
- An upward correction is emerging, marked by a breakout above a descending triangle pattern.
- A decisive move above the nine-day Exponential Moving Average at 99.63 could strengthen short-term price momentum.
The US Dollar Index (DXY), which tracks the performance of the US Dollar (USD) against a basket of six major currencies, has lost its intraday gains, trading around 99.00 during the European hours on Wednesday.
On the daily chart, technical analysis points to the beginning of an upward correction, with the index breaking above a descending triangle pattern. This move is supported by the 14-day Relative Strength Index (RSI), which has risen above the 30 level.
However, the DXY continues to trade within the corresponding descending channel, signaling that the broader bearish bias remains intact. At the same time, it's attempting to break above its nine-day Exponential Moving Average (EMA), which could point to emerging short-term bullish momentum.
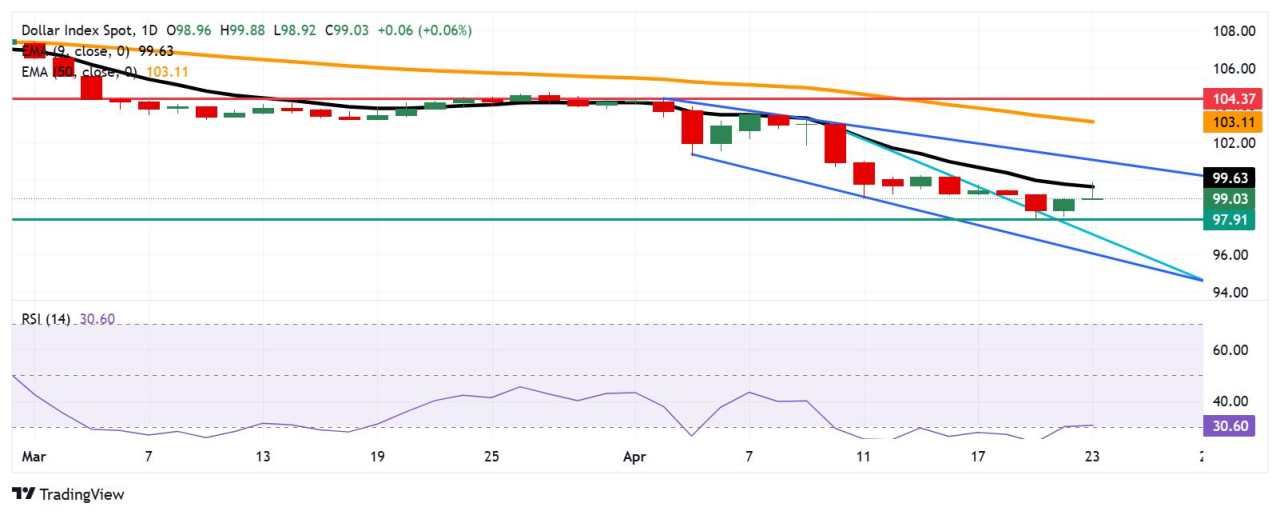
On the downside, immediate support is seen at the psychological level of 99.00, followed by 97.91 — the lowest level since March 2022. A break below this level could reinforce the bearish bias and put downward pressure on the US Dollar Index to return to the descending triangle around the 97.20 level.
To the upside, the nine-day EMA at 99.63 is acting as the immediate barrier. A decisive break above this level may enhance short-term price momentum and pave the way for a test of the key resistance zone near the upper boundary of the descending channel at the monthly high of 101.20, followed by the 50-day EMA at 103.11.
US Dollar Index: Daily Chart
US Dollar PRICE Today
The table below shows the percentage change of US Dollar (USD) against listed major currencies today. US Dollar was the weakest against the Australian Dollar.
| USD | EUR | GBP | JPY | CAD | AUD | NZD | CHF | |
|---|---|---|---|---|---|---|---|---|
| USD | 0.04% | 0.09% | 0.09% | -0.02% | -0.80% | -0.39% | 0.25% | |
| EUR | -0.04% | 0.03% | 0.03% | -0.07% | -0.80% | -0.45% | 0.20% | |
| GBP | -0.09% | -0.03% | 0.02% | -0.11% | -0.84% | -0.48% | 0.18% | |
| JPY | -0.09% | -0.03% | -0.02% | -0.11% | -0.78% | -0.50% | 0.19% | |
| CAD | 0.02% | 0.07% | 0.11% | 0.11% | -0.68% | -0.35% | 0.29% | |
| AUD | 0.80% | 0.80% | 0.84% | 0.78% | 0.68% | 0.37% | 1.00% | |
| NZD | 0.39% | 0.45% | 0.48% | 0.50% | 0.35% | -0.37% | 0.67% | |
| CHF | -0.25% | -0.20% | -0.18% | -0.19% | -0.29% | -1.00% | -0.67% |
The heat map shows percentage changes of major currencies against each other. The base currency is picked from the left column, while the quote currency is picked from the top row. For example, if you pick the US Dollar from the left column and move along the horizontal line to the Japanese Yen, the percentage change displayed in the box will represent USD (base)/JPY (quote).
作者:Akhtar Faruqui,文章来源FXStreet_id,版权归原作者所有,如有侵权请联系本人删除。
风险提示:本文所述仅代表作者个人观点,不代表 Followme 的官方立场。Followme 不对内容的准确性、完整性或可靠性作出任何保证,对于基于该内容所采取的任何行为,不承担任何责任,除非另有书面明确说明。


暂无评论,立马抢沙发