S2N spotlight
On a day I was short on time, I chose to try and spruce up the charts look and feel and do some data manipulation that would make a chiropractor jealous. I spent hours on this, hence the late delivery.
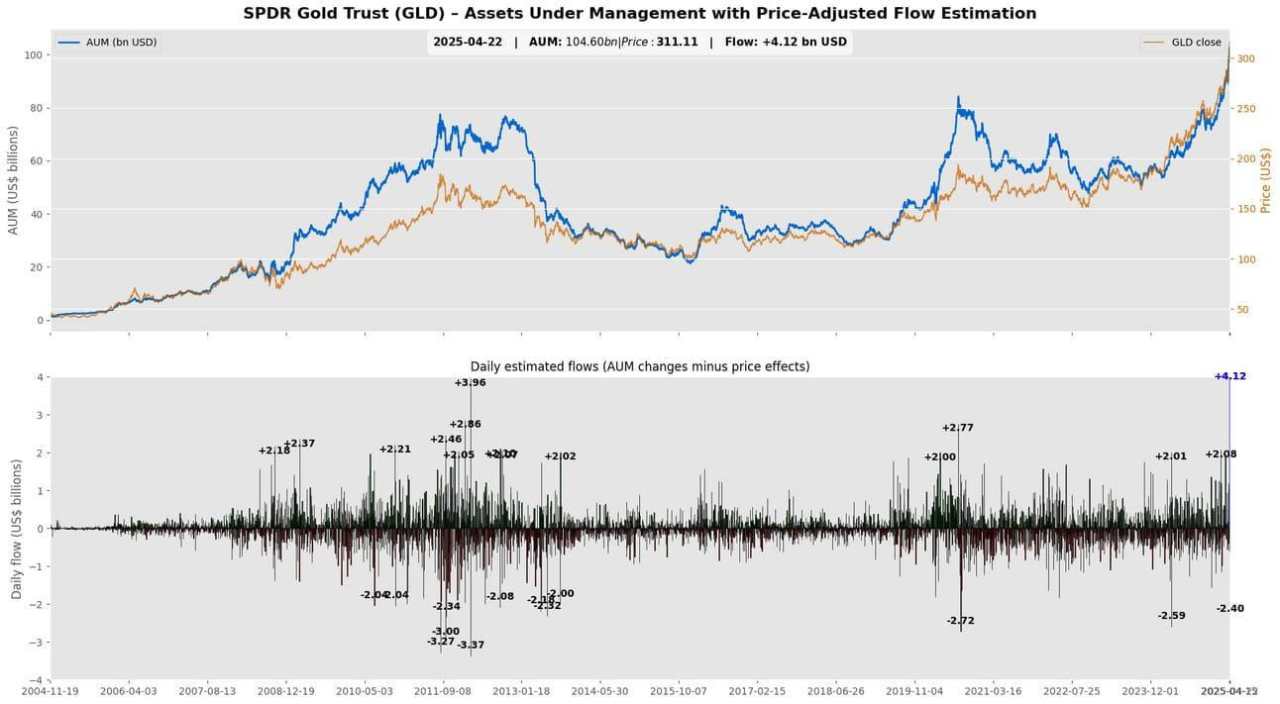
The positive, which I am super excited about, is I have figured out a way to calculate the flows into an ETF, ok, just GLD for today. Usually these are quite expensive data subscriptions, but I have done it the poor man's way and scraped and manipulated my way to an answer for free. I never get tired of that word.
I need to double-check my calculations for the in- and out-flows to be sure they are correct. Following the money in a major ETF can be useful when researching the probabilities of a trend continuing or reversing for that asset class.
The gold ETF, GLD, has $104 billion in assets; you can trace its growth in assets back to 2004. Yes, another gold record. Yesterday, despite it being a down day, saw the biggest inflow of cash into the ETF of $4 billion, not surprising after another all-time high. In my calculation of the flow of funds, I strip out the effect of the price action in the bottom pane. I focus on the new shares issued or cancelled without actually looking (my little manipulation) so I can show you the money.
S2N observations
I ran out of time.
S2N screener alert
I ran out of time.
S2N performance review

S2N chart gallery


S2N news today

作者:Michael Berman, PhD,文章来源FXStreet,版权归原作者所有,如有侵权请联系本人删除。
风险提示:本文所述仅代表作者个人观点,不代表 Followme 的官方立场。Followme 不对内容的准确性、完整性或可靠性作出任何保证,对于基于该内容所采取的任何行为,不承担任何责任,除非另有书面明确说明。


暂无评论,立马抢沙发