- NZD/USD could challenge the key resistance level at 0.6038, the highest point in six months.
- Technical indicators suggest prevailing short-term bullish momentum.
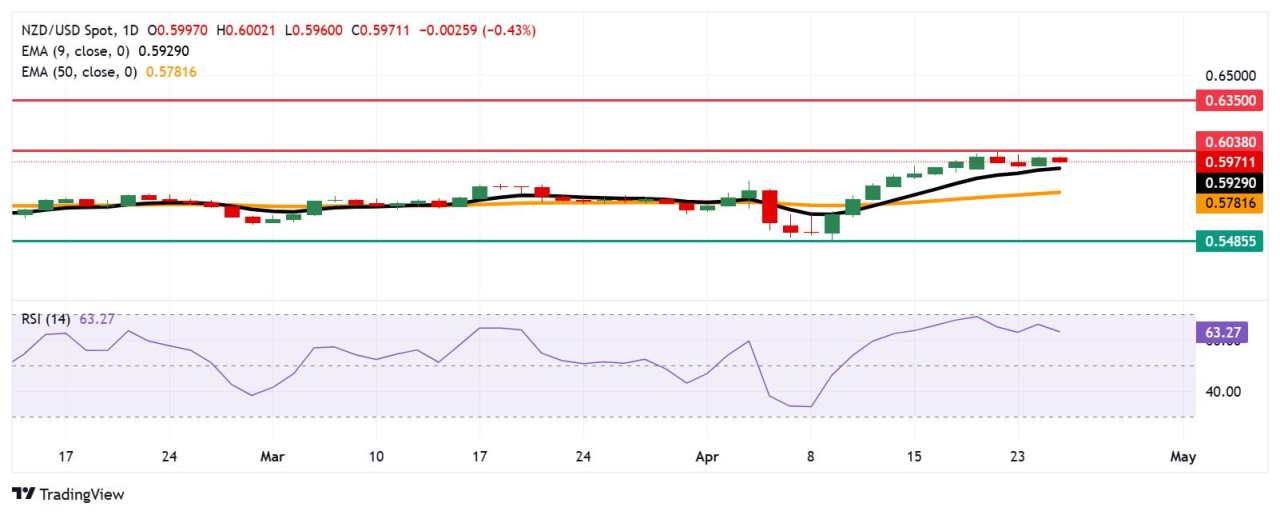
- Initial support is found at the nine-day EMA, currently at 0.5929.
The NZD/USD pair offers its recent gains registered in the previous session, trading around 0.5960 during early European trading hours on Friday.
Technical indicators on the daily chart suggest a bullish bias, with the pair remaining above the nine-day Exponential Moving Average (EMA), signaling improved short-term price momentum.
Moreover, the 14-day Relative Strength Index (RSI) is positioned above the 50 mark, suggesting the prevailing bullish bias.
A rebound toward to the 70 mark could reinforce the market sentiment to test six-month high of 0.6038, last seen in November 2024.
A sustained break above six-month high could open the doors to explore the area around its seven-month high near 0.6350, recorded in October 2024.
The initial support is located at the nine-day EMA at 0.5929. A break below this level could weaken the short-term bullish momentum and open the door for further downside toward the 50-day EMA at 0.5781.
Further depreciation would deepen the bearish bias and put the downward pressure on the NZD/USD pair to test support at 0.5485—a level not visited since March 2020.
NZD/USD: Daily Chart
New Zealand Dollar PRICE Today
The table below shows the percentage change of New Zealand Dollar (NZD) against listed major currencies today. New Zealand Dollar was the weakest against the US Dollar.
| USD | EUR | GBP | JPY | CAD | AUD | NZD | CHF | |
|---|---|---|---|---|---|---|---|---|
| USD | 0.37% | 0.28% | 0.65% | 0.12% | 0.08% | 0.41% | 0.62% | |
| EUR | -0.37% | -0.10% | 0.29% | -0.27% | -0.30% | 0.05% | 0.24% | |
| GBP | -0.28% | 0.10% | 0.38% | -0.16% | -0.19% | 0.13% | 0.31% | |
| JPY | -0.65% | -0.29% | -0.38% | -0.50% | -0.57% | -0.25% | -0.06% | |
| CAD | -0.12% | 0.27% | 0.16% | 0.50% | -0.13% | 0.30% | 0.47% | |
| AUD | -0.08% | 0.30% | 0.19% | 0.57% | 0.13% | 0.35% | 0.52% | |
| NZD | -0.41% | -0.05% | -0.13% | 0.25% | -0.30% | -0.35% | 0.17% | |
| CHF | -0.62% | -0.24% | -0.31% | 0.06% | -0.47% | -0.52% | -0.17% |
The heat map shows percentage changes of major currencies against each other. The base currency is picked from the left column, while the quote currency is picked from the top row. For example, if you pick the New Zealand Dollar from the left column and move along the horizontal line to the US Dollar, the percentage change displayed in the box will represent NZD (base)/USD (quote).
作者:Akhtar Faruqui,文章来源FXStreet_id,版权归原作者所有,如有侵权请联系本人删除。
风险提示:本文所述仅代表作者个人观点,不代表 Followme 的官方立场。Followme 不对内容的准确性、完整性或可靠性作出任何保证,对于基于该内容所采取的任何行为,不承担任何责任,除非另有书面明确说明。


加载失败()