- EUR/GBP trades near the 0.85 area after slipping during Monday’s session.
- Momentum indicators remain mixed, with shorter-term signals leaning bearish.
- Key support rests near 0.8498, while resistance zones cluster around 0.8525.
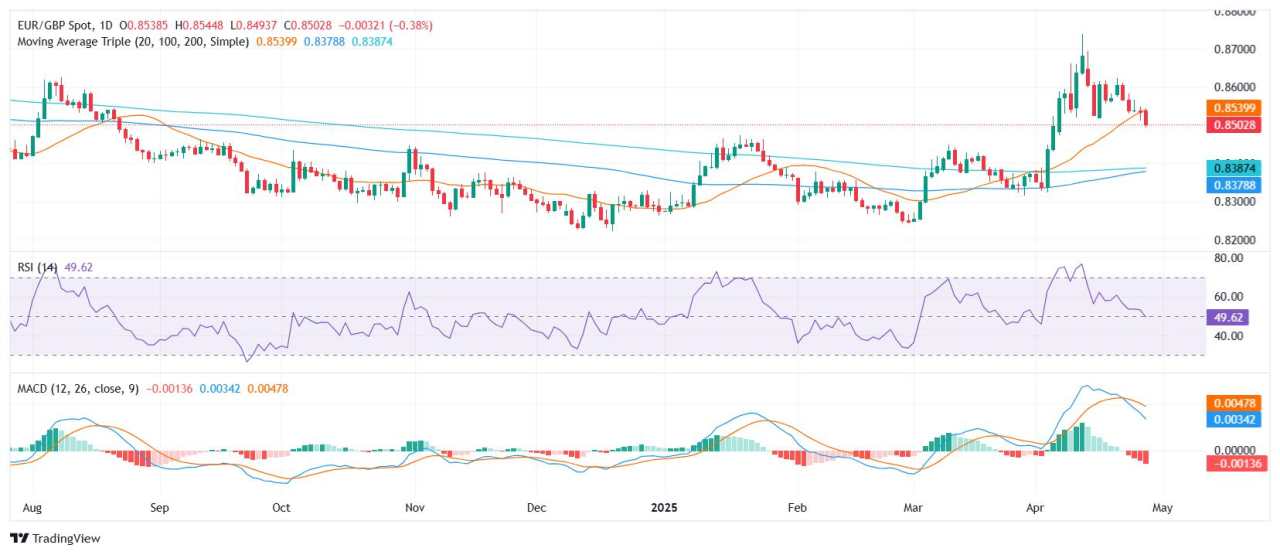
After Monday’s European session, the EUR/GBP pair was seen trading near the 0.85 zone, having moved lower earlier in the day. The pair slipped moderately and remains neutral overall, staying contained within today’s trading range. On the technical front, the Relative Strength Index (RSI) holds close to the 50 mark, showing neutrality, while the Moving Average Convergence Divergence (MACD) presents a sell signal. Other momentum indicators like the Williams Percent Range and the Ultimate Oscillator also display neutral stances. Meanwhile, a divergence between shorter and longer-term moving averages suggests some underlying uncertainty.
On the technical side, shorter-term pressure is evident, with the 20-day Simple Moving Average (SMA) near 0.8540 flashing a bearish signal as the pair trades beneath it. However, longer-term support persists, as both the 100-day SMA around 0.8379 and the 200-day SMA near 0.8389 continue to suggest a bullish trend over a broader horizon. The Ichimoku Base Line, flat around 0.8527, reinforces the neutral bias for now.
Support for EUR/GBP is located around the 0.8498 mark, followed by deeper cushions near 0.8482 and 0.8459. On the upside, resistance can be seen near 0.8515, with additional barriers at 0.8525 and 0.8527. Given the combination of a sell signal from the MACD and neutral readings from the Williams Percent Range and Ultimate Oscillator, the pair could remain in consolidation unless either buyers or sellers take stronger control in the next sessions.
Daily Chart
作者:Patricio Martín,文章来源FXStreet_id,版权归原作者所有,如有侵权请联系本人删除。
风险提示:本文所述仅代表作者个人观点,不代表 Followme 的官方立场。Followme 不对内容的准确性、完整性或可靠性作出任何保证,对于基于该内容所采取的任何行为,不承担任何责任,除非另有书面明确说明。


加载失败()