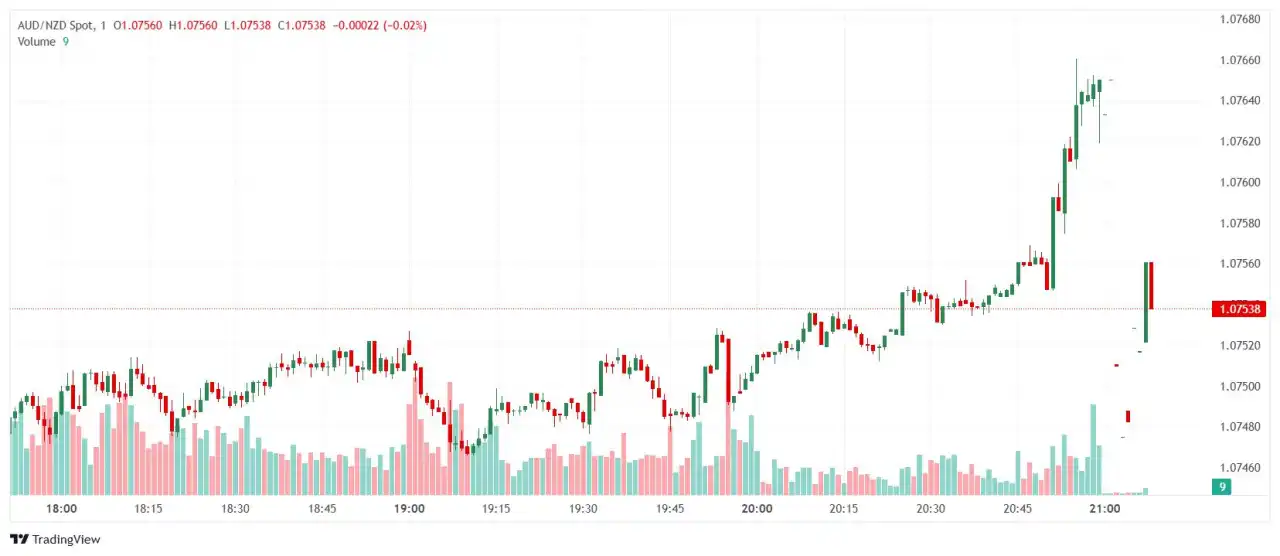
- AUD/NZD was seen trading around the 1.07 area, registering a slight decline on the day.
- The overall technical outlook suggests a bearish bias for the currency pair.
- Key Simple Moving Averages point to selling pressure, while the Relative Strength Index remains neutral, and the Moving Average Convergence Divergence shows a buy signal.
The AUD/NZD has experienced some downward pressure, hovering near the 1.07 zone on Tuesday. Despite mixed signals from some momentum indicators, the longer-term technical picture appears to favor the bears, with several moving averages reinforcing this sentiment.
The AUD/NZD pair is currently exhibiting a bearish technical bias. While the Moving Average Convergence Divergence indicator is flashing a buy signal, suggesting potential short-term upward momentum, the broader context leans negative. The Relative Strength Index sits in neutral territory around the 42 level, offering little directional conviction at present. However, both the 20-day, 100-day, and 200-day Simple Moving Averages are indicating sell positions, highlighting sustained bearish momentum over different timeframes. Similarly, the 30-day Exponential Moving Average and Simple Moving Average also point towards further declines.
Looking at potential price movements, immediate support is observed at 1.0746, followed by 1.0739 and then a lower level at 1.0717. On the upside, initial resistance can be found at 1.0774, with subsequent resistance levels at 1.0781 and 1.0786.
Daily chart
作者:Patricio Martín,文章来源FXStreet,版权归原作者所有,如有侵权请联系本人删除。
风险提示:以上内容仅代表作者或嘉宾的观点,不代表 FOLLOWME 的任何观点及立场,且不代表 FOLLOWME 同意其说法或描述,也不构成任何投资建议。对于访问者根据 FOLLOWME 社区提供的信息所做出的一切行为,除非另有明确的书面承诺文件,否则本社区不承担任何形式的责任。
FOLLOWME 交易社区网址: www.followme.ceo

