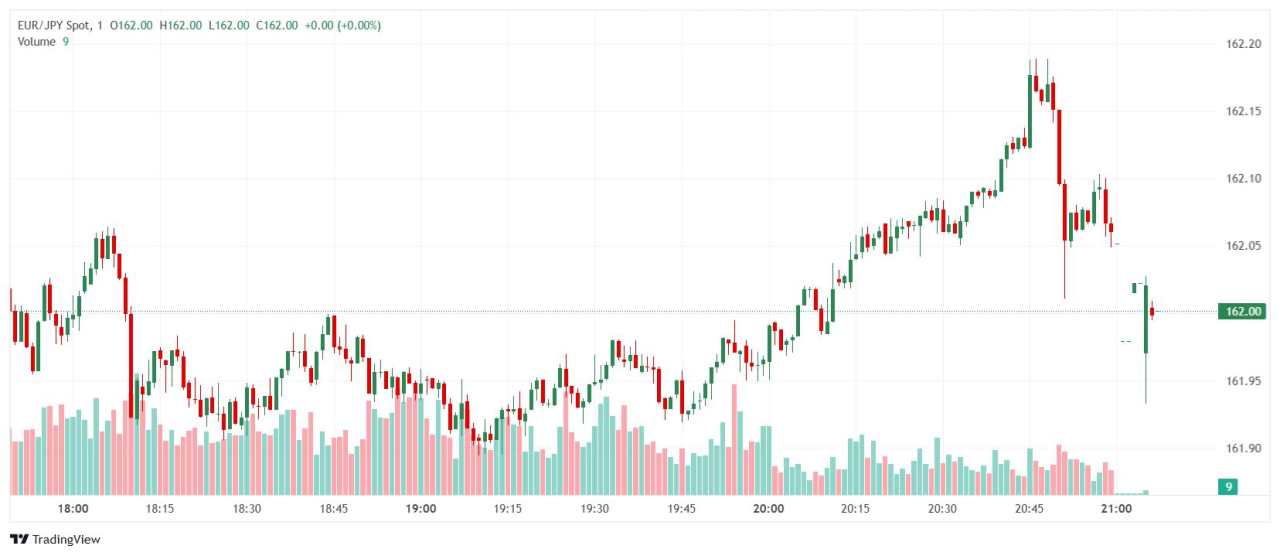
- EUR/JPY was observed trading around the 162.00 region, experiencing a slight pullback on the day.
- The overall technical analysis points towards a prevailing bullish sentiment for the currency pair.
- Key Simple Moving Averages indicate buying interest, while the Relative Strength Index is neutral, and the Moving Average Convergence Divergence suggests selling pressure.
In the lead-up to Tuesday's Asian trading session, EUR/JPY has seen a minor decline, trading near the 162.00 mark. Despite a sell signal from one momentum indicator, the broader technical landscape suggests underlying bullish strength, supported by several key moving averages.
The EUR/JPY pair currently displays a bullish technical outlook. While the Moving Average Convergence Divergence indicator is showing a sell signal, potentially indicating some short-term downward pressure, the longer-term trend appears positive. The Relative Strength Index resides in neutral territory around the 52 level, not providing a strong directional cue. However, the 20-day, 100-day, and 200-day Simple Moving Averages are all signaling buy opportunities, underscoring sustained bullish momentum across various time horizons. Similarly, the 30-day Exponential Moving Average and Simple Moving Average also support this upward trajectory. The Stochastic %K and Stochastic RSI Fast are both currently neutral.
Considering potential trading levels, immediate support is identified at 162.01, followed by 161.97 and then a lower level at 161.92. On the resistance side, the first barrier is at 162.17, with subsequent resistance levels at 162.22 and 162.68.
Daily Chart
作者:Patricio Martín,文章来源FXStreet_id,版权归原作者所有,如有侵权请联系本人删除。
风险提示:本文所述仅代表作者个人观点,不代表 Followme 的官方立场。Followme 不对内容的准确性、完整性或可靠性作出任何保证,对于基于该内容所采取的任何行为,不承担任何责任,除非另有书面明确说明。

暂无评论,立马抢沙发