- US NFP beats at 177K, but Fed seen delivering only three cuts instead of four.
- DXY drops 0.58% to 99.59, fueling demand for risk-sensitive currencies like the Aussie.
- Traders favor AUD as risk appetite improves and US policy outlook remains data-dependent.
The Australian Dollar surged to a new year-to-date (YTD) high of 0.6469, gaining over 1.20% following a strong jobs report in the United States (US) that suggested the economy remains solid.
AUD/USD jumps 1.20% to 0.6469 as Dollar weakens on shifting Fed rate cut bets and upbeat risk sentiment
Nonfarm Payroll figures in April rose by 177K, up from 130K projected, and trailed March’s downward revised 185K numbers. The Unemployment Rate was unchanged as expected at 4.2% and reaffirms the Federal Reserve’s (Fed) posture of waiting for the hard data to dictate monetary policy.
Hence, traders who expected four rate cuts according to the Fed Funds rates futures now expect three.
Despite the strong data, the Aussie Dollar is also rising as the US Dollar Index (DXY) tumbles. The DXY who tracks the performance of the American Dollar against a basket of six peers, is down 0.58% at 99.59.
AUD/USD Price Chart – Daily
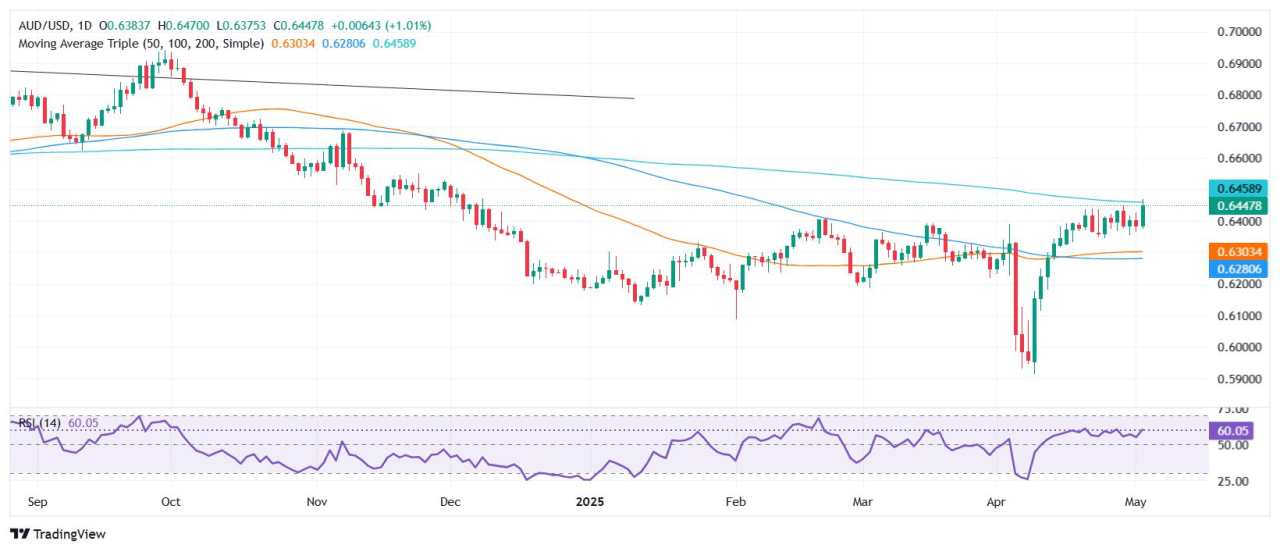
Although hitting new yearly highs, traders should know that the 200-day Simple Moving Average (SMA) at 0.6461 is the first resistance level. A decisive break will expose the 0.6500 figure and the November 25 peak at 0.6549. Failure at the 200-day SMA would exacerbate a pullback toward 0.6400 and lower the exchange rate.
Australian Dollar PRICE This year
The table below shows the percentage change of Australian Dollar (AUD) against listed major currencies this year. Australian Dollar was the strongest against the US Dollar.
| USD | EUR | GBP | JPY | CAD | AUD | NZD | CHF | |
|---|---|---|---|---|---|---|---|---|
| USD | -8.65% | -5.84% | -8.24% | -4.16% | -3.99% | -6.08% | -9.02% | |
| EUR | 8.65% | 3.13% | 0.54% | 5.00% | 5.14% | 2.90% | -0.32% | |
| GBP | 5.84% | -3.13% | -2.50% | 1.83% | 1.95% | -0.22% | -3.34% | |
| JPY | 8.24% | -0.54% | 2.50% | 4.45% | 4.65% | 2.38% | -0.82% | |
| CAD | 4.16% | -5.00% | -1.83% | -4.45% | 0.07% | -2.02% | -5.08% | |
| AUD | 3.99% | -5.14% | -1.95% | -4.65% | -0.07% | -2.12% | -5.17% | |
| NZD | 6.08% | -2.90% | 0.22% | -2.38% | 2.02% | 2.12% | -3.13% | |
| CHF | 9.02% | 0.32% | 3.34% | 0.82% | 5.08% | 5.17% | 3.13% |
The heat map shows percentage changes of major currencies against each other. The base currency is picked from the left column, while the quote currency is picked from the top row. For example, if you pick the Australian Dollar from the left column and move along the horizontal line to the US Dollar, the percentage change displayed in the box will represent AUD (base)/USD (quote).
作者:Christian Borjon Valencia,文章来源FXStreet_id,版权归原作者所有,如有侵权请联系本人删除。
风险提示:本文所述仅代表作者个人观点,不代表 Followme 的官方立场。Followme 不对内容的准确性、完整性或可靠性作出任何保证,对于基于该内容所采取的任何行为,不承担任何责任,除非另有书面明确说明。


加载失败()