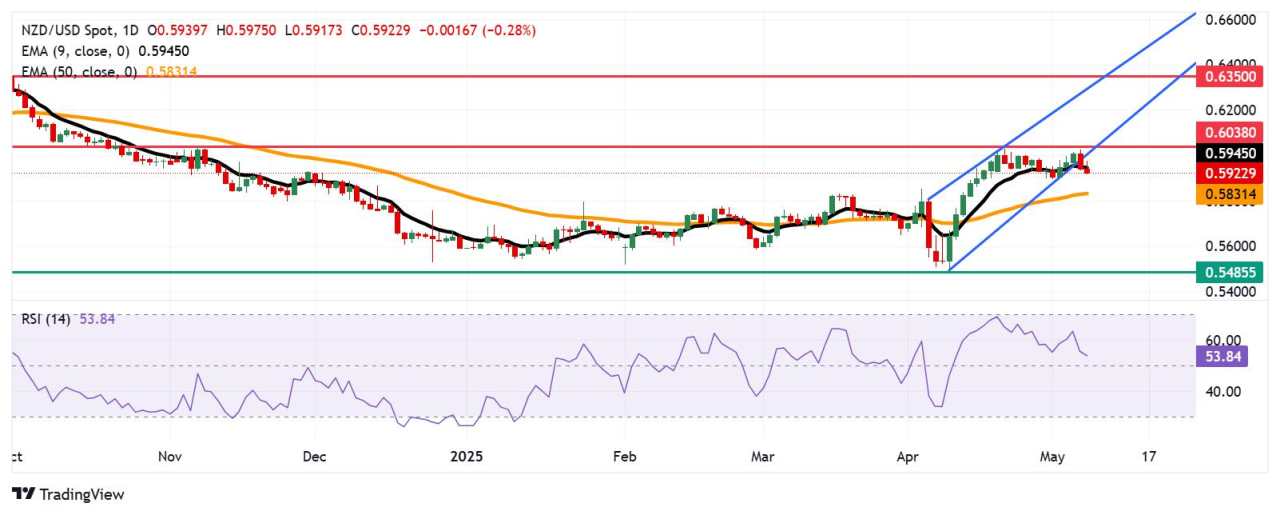
- NZD/USD may initially find support near the 50-day EMA at 0.5830.
- The 14-day RSI remaining above the 50 level suggests a sustained bullish bias.
- A breakout above the nine-day EMA at 0.5946 could pave the way for the pair to re-enter the ascending channel.
The NZD/USD pair extends losses for the second successive session, trading around 0.5930 during European hours on Thursday. The technical analysis of the daily chart indicates a weakening bullish bias, as the pair trades further below the ascending channel pattern.
Additionally, the NZD/SUD pair is positioned below the nine-day Exponential Moving Average (EMA), suggesting the short-term price momentum is weaker. However, the 14-day Relative Strength Index (RSI) is still positioned above the 50 mark, suggesting the bullish bias is in play. If 14-day RSI breaks below the 50 mark, it could confirm the bearish market shift.
On the downside, the NZD/USD pair could find the initial support around the 50-day EMA at 0.5831, followed by the psychological level of 0.5800. A break below this crucial support zone could weaken the medium-term price momentum and put downward pressure on the NZD/USD pair to test support at 0.5485—a level not visited since March 2020.
The immediate barrier appears at the nine-day EMA of 0.5945, followed by the lower boundary of the ascending channel around 0.6000. A return to the channel could revive the bullish bias and support the pair to test the six-month high of 0.6038, last seen in November 2024. A sustained break above this level could open the doors to explore the area around the ascending channel’s upper boundary around 0.6280, followed by the seven-month high near 0.6350, recorded in October 2024.
NZD/USD: Daily Chart
New Zealand Dollar PRICE Today
The table below shows the percentage change of New Zealand Dollar (NZD) against listed major currencies today. New Zealand Dollar was the weakest against the US Dollar.
| USD | EUR | GBP | JPY | CAD | AUD | NZD | CHF | |
|---|---|---|---|---|---|---|---|---|
| USD | 0.07% | 0.10% | 0.53% | 0.18% | 0.06% | 0.23% | 0.47% | |
| EUR | -0.07% | 0.05% | 0.47% | 0.09% | 0.00% | 0.17% | 0.41% | |
| GBP | -0.10% | -0.05% | 0.46% | 0.07% | -0.02% | 0.13% | 0.34% | |
| JPY | -0.53% | -0.47% | -0.46% | -0.37% | -0.47% | -0.31% | -0.11% | |
| CAD | -0.18% | -0.09% | -0.07% | 0.37% | -0.11% | 0.06% | 0.26% | |
| AUD | -0.06% | -0.00% | 0.02% | 0.47% | 0.11% | 0.17% | 0.40% | |
| NZD | -0.23% | -0.17% | -0.13% | 0.31% | -0.06% | -0.17% | 0.20% | |
| CHF | -0.47% | -0.41% | -0.34% | 0.11% | -0.26% | -0.40% | -0.20% |
The heat map shows percentage changes of major currencies against each other. The base currency is picked from the left column, while the quote currency is picked from the top row. For example, if you pick the New Zealand Dollar from the left column and move along the horizontal line to the US Dollar, the percentage change displayed in the box will represent NZD (base)/USD (quote).
作者:Akhtar Faruqui,文章来源FXStreet_id,版权归原作者所有,如有侵权请联系本人删除。
风险提示:本文所述仅代表作者个人观点,不代表 Followme 的官方立场。Followme 不对内容的准确性、完整性或可靠性作出任何保证,对于基于该内容所采取的任何行为,不承担任何责任,除非另有书面明确说明。


加载失败()