- USD/JPY gains on Fed decision and upbeat US-UK trade news.
- US jobless claims fall to 228K, supporting broad USD strength.
- Technical indicators show support at 144.78 and resistance at 146.18.
The USD/JPY pair surged higher as the US Dollar (USD) strengthened following the Federal Reserve’s decision to leave interest rates unchanged, coupled with renewed optimism over US-UK trade ties. US President Donald Trump highlighted what he described as a "major breakthrough" in trade relations with the United Kingdom, boosting market sentiment. However, caution remains as details about the agreement indicate that a 10% tariff on UK goods will remain, potentially tempering initial enthusiasm.
The US Dollar Index (DXY) pushed past the critical 100.00 mark, supported by robust economic data and the Federal Reserve’s steady policy stance. Weekly jobless claims fell to 228K for the week ending May 3, down from 241K in the prior week, signaling continued strength in the US labor market. The Bank of Japan (BOJ) minutes from its March meeting showed a cautious outlook, with policymakers concerned about the impact of US tariffs on Japan’s export-dependent economy. This divergence in central bank policies has favored the USD over the JPY.
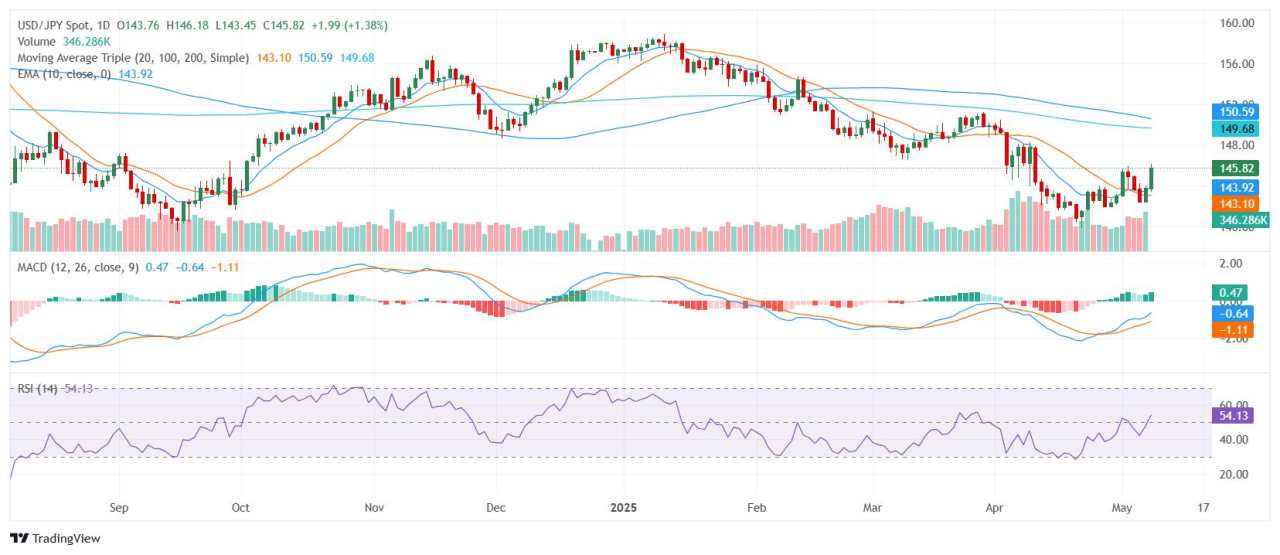
Technical Analysis
Technically, USD/JPY is trading in a bullish pattern, currently hovering near 146.00 after reaching a daily high of 146.18. The RSI stands at 54.16, reflecting a neutral bias, while the MACD shows a clear buy signal. Short-term moving averages, including the 10-day EMA (143.90) and 10-day SMA (143.69), are aligned in a bullish configuration. However, longer-term resistance levels remain at the 100-day SMA (150.55) and 200-day SMA (149.58), potentially capping further gains.
Key support levels are identified at 144.78, 144.63, and 144.56, while resistance is seen at 146.18, 146.42, and 148.35.
In summary, USD/JPY remains poised for further upside as long as it holds above key support levels, with traders closely monitoring incoming US economic data and geopolitical headlines for potential volatility in the coming sessions.
Daily Chart
作者:Patricio Martín,文章来源FXStreet_id,版权归原作者所有,如有侵权请联系本人删除。
风险提示:本文所述仅代表作者个人观点,不代表 Followme 的官方立场。Followme 不对内容的准确性、完整性或可靠性作出任何保证,对于基于该内容所采取的任何行为,不承担任何责任,除非另有书面明确说明。


加载失败()