Understanding the dynamics between the Euro and the British Pound is crucial for forex traders. This analysis delves into the relative strength of the Euro commercial long/short ratio against the British Pound commercial long/short ratio, offering insights into potential future movements of the EUR/GBP currency pair. This ratio of commercial long/short ratios reveals which currency has a more bullish or bearish commercial positioning relative to the other. The chart below tracks the historical fluctuations of this relative strength. Higher values suggest that commercial traders are more bullish (or less bearish) on the Euro compared to the Pound, and vice-versa for lower values.
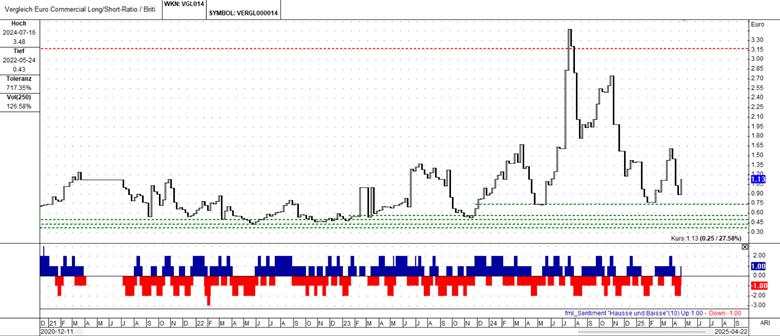
Chart 1: Euro commercial long/short-ratio vs British Pound commercial long/short ratio
Key Takeaway: This chart illustrates the historical shifts in the relative commercial sentiment between the Euro and the British Pound.
The horizontal red and green lines on the chart often represent significant support and resistance levels. Red lines typically indicate resistance (price levels where upward movement has historically been difficult), while green lines indicate support (price levels where downward movement has historically been difficult). These levels are crucial for traders identifying potential turning points in the relative strength.
The histogram at the bottom provides a sentiment indicator derived from the long/short ratios. Blue bars generally indicate bullish sentiment (positive values), and red bars indicate bearish sentiment (negative values). The intensity or height of these bars can suggest the strength of the prevailing sentiment.
The chart highlights the significant volatility in the Euro's commercial positioning compared to the British Pound. The recent surge to the 3.00 level indicated a period of strong Euro outperformance in terms of commercial positioning. However, the subsequent decline suggests a potential loss of this relative strength. Monitoring the current level around 1.13 in relation to the support level at 0.65 will be crucial to determine if the Euro can regain its upward momentum or if the Pound will gain further relative strength.
Analyzing relative strength with technical indicators
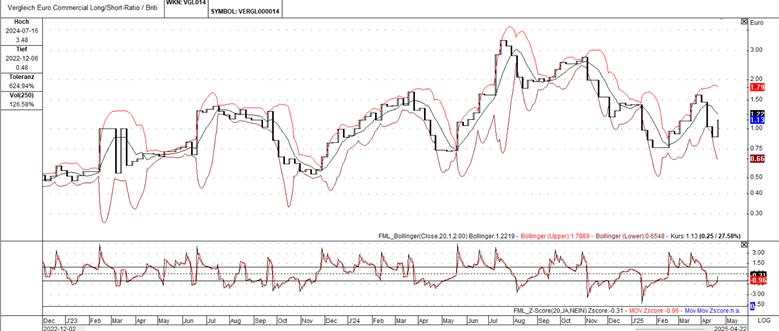
Chart 2: Euro commercial long/short-ratio vs British Pound commercial long/short ratio with technical indicators
Key Takeaway: This chart adds technical analysis tools to provide a more nuanced view of the relative commercial strength.
This chart builds upon the previous one by incorporating technical indicators to offer additional context and analysis tools. The current Z-Score of -0.36 indicates a recent shift in momentum.
This chart offers a more nuanced analysis by incorporating Bollinger Bands and moving averages. The recent peak in relative Euro strength coincided with the price hitting the upper Bollinger Band, suggesting a potential overbought condition. The subsequent pullback is confirmed by the price moving below the moving averages. Watching for a potential bearish crossover of the moving averages and a further decline towards the lower Bollinger Band would be prudent. If the price breaks below the lower Bollinger Band, it could signal a sustained period of Pound outperformance.
EUR/GBP forex price action
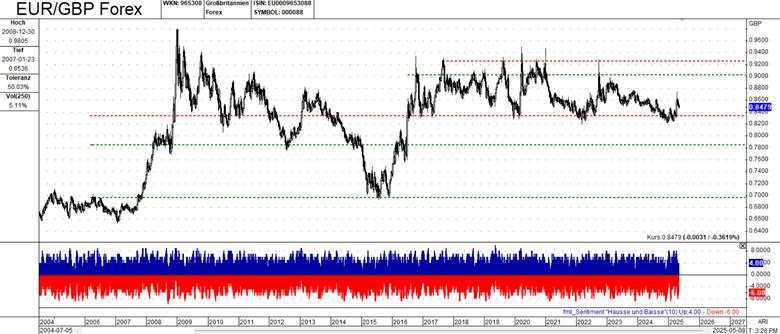
Chart 3 : EUR/GBP forex pair
Key Takeaway: This standard price chart shows the historical exchange rate movements of the EUR/GBP pair.
This is a standard price chart illustrating the exchange rate of the Euro against the British Pound over time. Higher values indicate the Euro is strengthening against the Pound, while lower values indicate the Pound is strengthening against the Euro.
The EUR/GBP chart shows a period of significant volatility followed by a more prolonged period of consolidation. The pair is currently trading around 0.8475. The support and resistance levels at 0.8250 and 0.9225 are key levels to watch for potential price reactions. The sentiment histogram at the bottom suggests a generally balanced sentiment, with recent fluctuations. For a comprehensive analysis, it's essential to compare this chart with Charts 1 and 2. For instance, if we observe that a rise in the Euro's relative commercial strength (Charts 1 and 2) is accompanied by an upward movement in the EUR/GBP price, it would strengthen our conviction in a potential Euro bullish trend.
Connecting the charts: A comprehensive analysis
The interplay between commercial positioning (Charts 1 and 2) and the EUR/GBP forex price action (Chart 3) reveals a complex situation with a slight bearish lean towards the Euro in the short to medium term.
Key takeaways from commercial positioning: Charts 1 and 2 indicate that the Euro's relative commercial strength compared to the Pound has been declining after a period of significant outperformance. This suggests that large commercial players may be reducing their bullish bets on the Euro or increasing their bearish bets, relative to the Pound. This weakening is further supported by the shift in momentum seen in the Z-Score.
EUR/GBP price action and support levels: The EUR/GBP pair (Chart 3) is currently trading close to a crucial support level around 0.8250. Support levels represent price floors where buying pressure is expected to emerge, potentially halting further declines. However, testing a support level multiple times weakens it, increasing the likelihood of a breakdown.
The correlation explained: The recent decline in the Euro's relative commercial strength (Charts 1 and 2) aligns with the EUR/GBP's struggle to stay above the 0.8250 support level (Chart 3). This correlation strengthens the inference that commercial positioning is influencing the forex pair. If commercial traders are indeed reducing their Euro longs or increasing their Pound longs, it would exert downward pressure on the EUR/GBP.
Market sentiment and volatility: The sentiment histograms across the charts show a degree of neutrality, lacking a strong bullish or bearish conviction. This suggests market indecision and the potential for increased volatility as the market seeks direction. The widening Bollinger Bands on Chart 2 hint at increasing volatility in the relative strength between the Euro and Pound. This volatility in commercial positioning could translate to sharper price swings in the EUR/GBP pair.
Inference: The overarching inference is that the Euro is currently vulnerable against the Pound. The combination of weakening relative commercial strength and the EUR/GBP pair's position near critical support suggests a higher probability of further Euro depreciation. However, the lack of strong directional sentiment necessitates a cautious approach and a focus on confirmation and risk management.
What's next? Traders should closely monitor the EUR/GBP price action around the 0.8250 support level. A break below this level, coupled with continued weakness in the Euro's relative commercial strength, could signal further downside. Conversely, a strong bounce from this support, accompanied by a resurgence in Euro commercial positioning, might indicate a potential reversal.
作者:FxPro Traders Research Team,文章来源FXStreet,版权归原作者所有,如有侵权请联系本人删除。
风险提示:以上内容仅代表作者或嘉宾的观点,不代表 FOLLOWME 的任何观点及立场,且不代表 FOLLOWME 同意其说法或描述,也不构成任何投资建议。对于访问者根据 FOLLOWME 社区提供的信息所做出的一切行为,除非另有明确的书面承诺文件,否则本社区不承担任何形式的责任。
FOLLOWME 交易社区网址: www.followme.ceo


加载失败()