- NZD/USD may face immediate resistance near the nine-day EMA at 0.5912.
- The 14-day RSI sits at the 50 level, indicating a neutral bias.
- The pair may retest initial support at the rectangle’s lower boundary around 0.5850.
The NZD/USD pair retraces its recent losses registered in the previous session, trading around 0.5890 during the European hours on Tuesday. The technical analysis of the daily chart suggests a neutral outlook, with the pair consolidating within a rectangular range.
Additionally, the 14-day Relative Strength Index (RSI) is positioned on the 50 mark, suggesting a neutral bias. A clearer directional trend may emerge with further price movement. However, the NZD/USD pair remains below the nine-day Exponential Moving Average (EMA), signaling weak short-term momentum.
The immediate barrier appears at the nine-day EMA of 0.5912. A break above this level could reinforce the short-term price momentum and support the NZD/USD pair to approach the rectangle’s upper boundary at 0.6020, followed by the six-month high of 0.6038, last seen in November 2024. Further resistance seems at the seven-month high near 0.6350, recorded in October 2024.
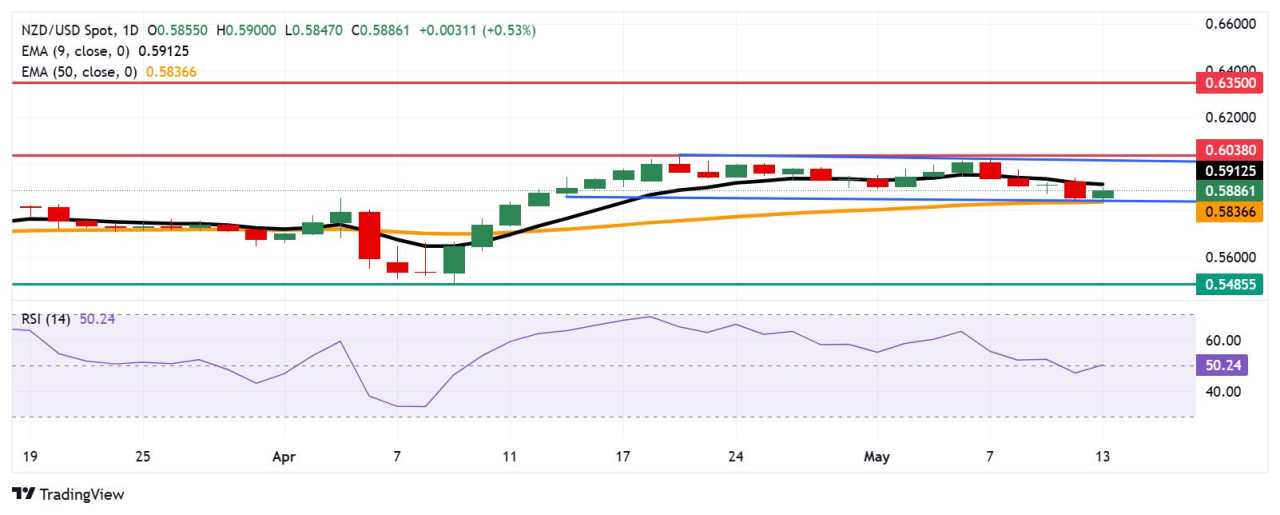
On the downside, the NZD/USD pair may retest the initial support at the lower boundary of the rectangle around 0.5850, followed by the 50-day EMA at 0.5836. A break below this crucial support zone could weaken the medium-term price momentum and put downward pressure on the NZD/USD pair to test support at 0.5485, a level not visited since March 2020.
NZD/USD: Daily Chart
New Zealand Dollar PRICE Today
The table below shows the percentage change of New Zealand Dollar (NZD) against listed major currencies today. New Zealand Dollar was the strongest against the Canadian Dollar.
| USD | EUR | GBP | JPY | CAD | AUD | NZD | CHF | |
|---|---|---|---|---|---|---|---|---|
| USD | -0.15% | -0.22% | -0.34% | 0.10% | -0.47% | -0.53% | -0.60% | |
| EUR | 0.15% | -0.07% | -0.15% | 0.25% | -0.31% | -0.36% | -0.41% | |
| GBP | 0.22% | 0.07% | -0.10% | 0.31% | -0.22% | -0.32% | -0.34% | |
| JPY | 0.34% | 0.15% | 0.10% | 0.45% | -0.13% | -0.22% | -0.21% | |
| CAD | -0.10% | -0.25% | -0.31% | -0.45% | -0.65% | -0.63% | -0.68% | |
| AUD | 0.47% | 0.31% | 0.22% | 0.13% | 0.65% | -0.05% | -0.10% | |
| NZD | 0.53% | 0.36% | 0.32% | 0.22% | 0.63% | 0.05% | -0.05% | |
| CHF | 0.60% | 0.41% | 0.34% | 0.21% | 0.68% | 0.10% | 0.05% |
The heat map shows percentage changes of major currencies against each other. The base currency is picked from the left column, while the quote currency is picked from the top row. For example, if you pick the New Zealand Dollar from the left column and move along the horizontal line to the US Dollar, the percentage change displayed in the box will represent NZD (base)/USD (quote).
作者:Akhtar Faruqui,文章来源FXStreet_id,版权归原作者所有,如有侵权请联系本人删除。
风险提示:本文所述仅代表作者个人观点,不代表 Followme 的官方立场。Followme 不对内容的准确性、完整性或可靠性作出任何保证,对于基于该内容所采取的任何行为,不承担任何责任,除非另有书面明确说明。

暂无评论,立马抢沙发