- USD/CAD trades near 1.3975, approaching the 50-day EMA at 1.4030.
- Daily RSI holds above 52, price structure points to potential breakout.
- 4-hour chart shows higher lows, support holds at 50-period EMA near 1.3900.
USD/CAD is holding steady near 1.3975 in the American session on Wednesday, with bulls attempting to reclaim control after a strong bounce from the 1.3900 zone earlier in the day. Price action on the daily chart remains constructive, with the pair now challenging the 50-day Exponential Moving Average (EMA) at 1.4030, a key dynamic resistance zone.
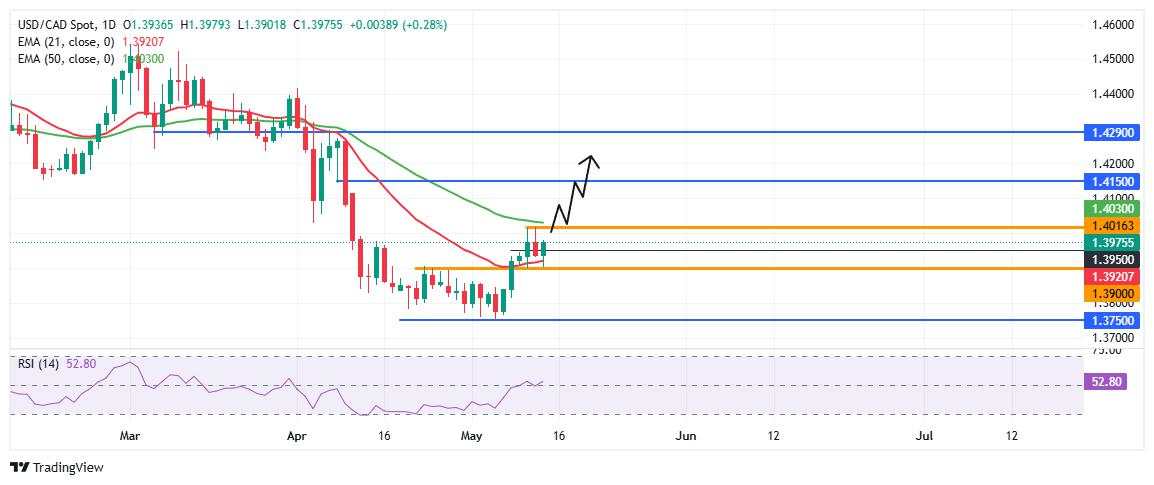
The daily structure turned bullish after USD/CAD closed above the 21-day EMA (1.3920) earlier this week. A sustained break and close above the 50-day EMA would confirm a breakout from the recent consolidation zone and expose the next upside targets at 1.4150 and 1.4290 near April’s high. The Relative Strength Index (RSI) on the daily chart holds at 52, showing a mild bullish bias without signaling overbought conditions.
On the downside, the 1.3900 mark remains a critical pivot, also aligning with the neckline of the recent consolidation base. A decisive break below this level could attract fresh selling pressure and potentially drag the pair back toward the April lows near 1.3750.
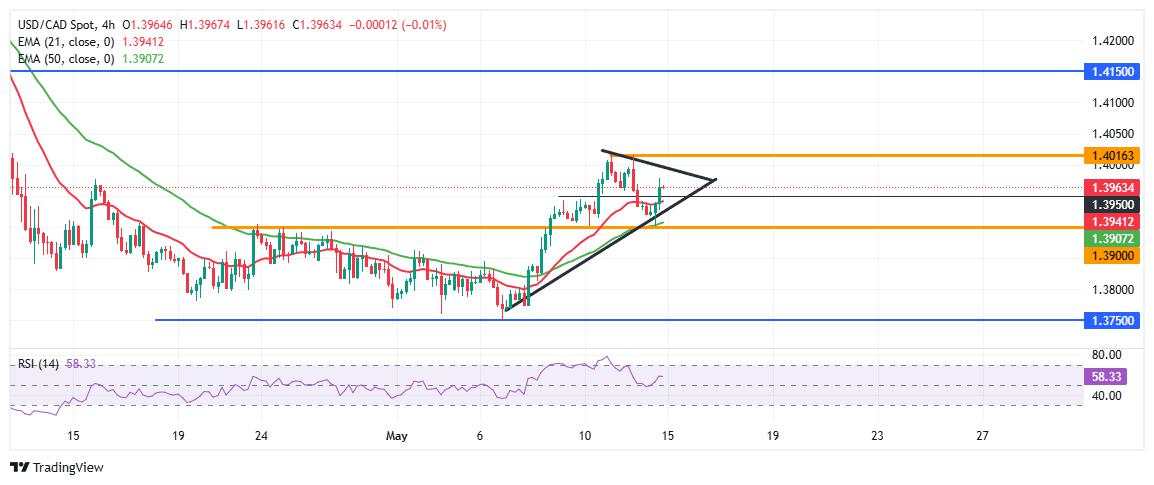
On the four-hour chart, USD/CAD has broken decisively above the 1.3950 mark, reclaiming both the 21-period EMA ( at 1.3939) and the 50-period EMA (at 1.3905), which were previously acting as dynamic resistance. This bullish crossover is technically constructive and reinforces a near-term upward bias.
The pair formed a clean intraday bottom at 1.3901 during the Asian session, which now acts as short-term support alongside the 50-EMA. The Relative Strength Index (RSI) has climbed back to 60.10, well into bullish territory but not yet overbought, signaling room for further upside.
Key resistance is located at 1.4015, the May high and previous rejection point. A clean break above this would signal a continuation of the bullish breakout, potentially targeting the 1.4070–1.4100 zone, where the pair last found sellers in early April.
However, failure to break above 1.4015 on the next attempt could confirm a near-term double-top formation, leaving the pair vulnerable to another retest of the 1.3900–1.3910 demand zone.
This rally is occurring on relatively moderate volume, suggesting short-covering and reactive flows rather than aggressive accumulation. From a structural standpoint, the pair is trading inside a rising wedge pattern, often considered a continuation or reversal setup depending on the breakout direction.
Moreover, the 1.3900–1.3930 area is a former resistance-turned-support region backed by horizontal demand and moving average confluence. A sustained hold above this zone is critical to preserve the short-term bullish outlook.
Traders will be watching Thursday’s US Producer Price Index (PPI), Retail Sales, and Canadian Housing Starts data closely for potential catalysts that could trigger a breakout or a reversal from current levels.
作者:Vishal Chaturvedi,文章来源FXStreet,版权归原作者所有,如有侵权请联系本人删除。
风险提示:以上内容仅代表作者或嘉宾的观点,不代表 FOLLOWME 的任何观点及立场,且不代表 FOLLOWME 同意其说法或描述,也不构成任何投资建议。对于访问者根据 FOLLOWME 社区提供的信息所做出的一切行为,除非另有明确的书面承诺文件,否则本社区不承担任何形式的责任。
FOLLOWME 交易社区网址: www.followme.ceo


加载失败()