- GBP/JPY retreats after hitting 196.39, forming bearish engulfing candle suggesting downside risk.
- Break below 194.22 could open path toward 193.31 Tenkan-sen and 200-day SMA at 192.32.
- Bulls need to reclaim 195.00 to retest resistance at 196.00 and May high of 196.39.
The GBP/JPY retreated on Wednesday, losing over 0.82% after hitting a weekly high of 196.39 earlier during the Asian session. As Thursday's Asian session begins, the GBP/JPY trades at 194.48 flat.
GBP/JPY Price Forecast: Technical outlook
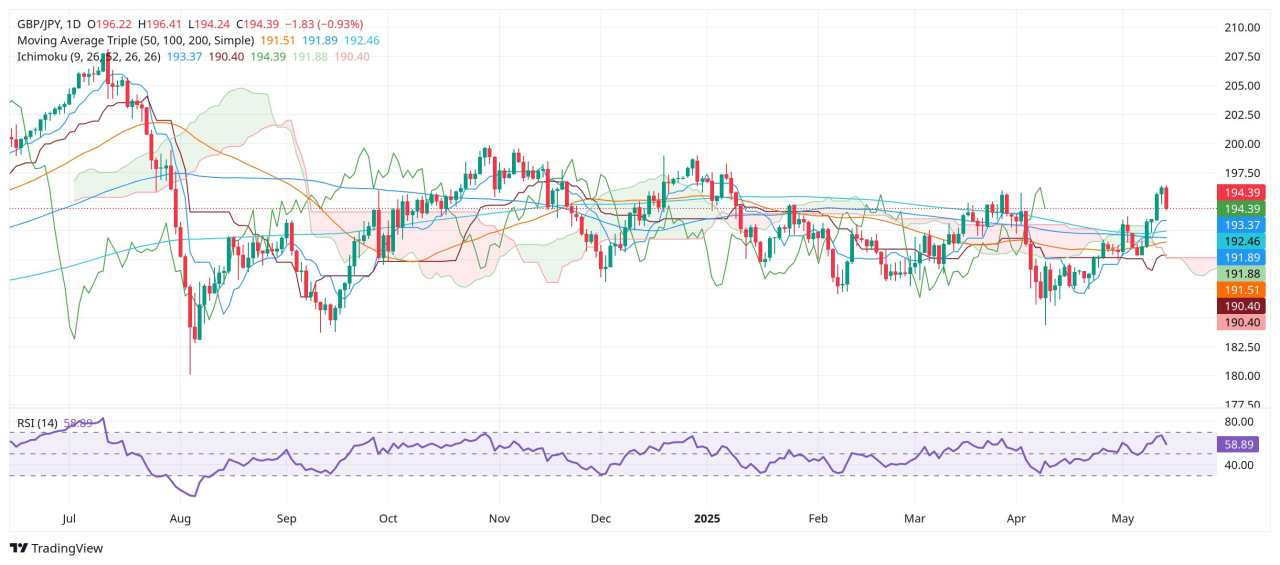
Despite retreating, the uptrend on the GBP/JPY remains intact. However, a pullback is on the cards after forming a ‘bearish engulfing’ candle chart pattern that could send the pair drifting lower. Still, a break below the May 14 low of 194.22 is required for further confirmation that the pair is extending its losses.
In that outcome, the next support would be the Tenkan.sen at 193.31, ahead of the 200-day Simple Moving Average (SMA) at 192.32.
Conversely, if GBP/JPY reverses its course and buyers reclaim 195.00, the next resistance would be the 196.00 figure, followed by the May 14 peak of 196.39. Further gains are seen if the latter is cleared, with 197.00 emerging as the next potential ceiling level.
GBP/JPY Price Chart – Daily
British Pound PRICE This week
The table below shows the percentage change of British Pound (GBP) against listed major currencies this week. British Pound was the strongest against the Swiss Franc.
| USD | EUR | GBP | JPY | CAD | AUD | NZD | CHF | |
|---|---|---|---|---|---|---|---|---|
| USD | 0.55% | 0.31% | 0.18% | 0.55% | -0.18% | 0.47% | 0.75% | |
| EUR | -0.55% | -0.12% | 0.16% | 0.48% | -0.11% | 0.40% | 0.69% | |
| GBP | -0.31% | 0.12% | 0.47% | 0.60% | 0.02% | 0.44% | 0.81% | |
| JPY | -0.18% | -0.16% | -0.47% | 0.38% | -0.97% | -0.56% | 0.36% | |
| CAD | -0.55% | -0.48% | -0.60% | -0.38% | -0.45% | -0.08% | 0.21% | |
| AUD | 0.18% | 0.11% | -0.02% | 0.97% | 0.45% | 0.41% | 0.77% | |
| NZD | -0.47% | -0.40% | -0.44% | 0.56% | 0.08% | -0.41% | 0.27% | |
| CHF | -0.75% | -0.69% | -0.81% | -0.36% | -0.21% | -0.77% | -0.27% |
The heat map shows percentage changes of major currencies against each other. The base currency is picked from the left column, while the quote currency is picked from the top row. For example, if you pick the British Pound from the left column and move along the horizontal line to the US Dollar, the percentage change displayed in the box will represent GBP (base)/USD (quote).
作者:Christian Borjon Valencia,文章来源FXStreet_id,版权归原作者所有,如有侵权请联系本人删除。
风险提示:本文所述仅代表作者个人观点,不代表 Followme 的官方立场。Followme 不对内容的准确性、完整性或可靠性作出任何保证,对于基于该内容所采取的任何行为,不承担任何责任,除非另有书面明确说明。


加载失败()