- AUD/USD trades near 0.6400, giving back early session gains after strong Australian jobs data.
- US Dollar steadies as DXY holds just below 101.00 amid mixed economic data.
- Technical signals remain mixed, with neutral RSI and conflicting SMA trends around key levels.
The AUD/USD pair is trading near the 0.6400 zone, retreating from earlier highs as the US Dollar regains strength. This pullback follows a solid Australian labor market report, which showed a robust 89,000 jobs gain in April, significantly exceeding the 22,500 expected and marking a sharp recovery from the prior month. Despite this, the Australian Dollar struggled to maintain momentum as broader market sentiment turned cautious ahead of US economic data releases, including Retail Sales and Producer Price Index (PPI) figures.
Fundamentally, the US Dollar Index (DXY) remains under pressure, trading just below 101.00. US data this week painted a mixed picture, with Retail Sales rising just 0.1% in April and the PPI cooling to 2.4% annually, both missing expectations. Additionally, weekly jobless claims held steady at 229K, reflecting a stable yet cautious labor market. These figures suggest that while the US economy remains resilient, growth momentum is slowing, keeping the Greenback within a tight range.
Technical Analysis
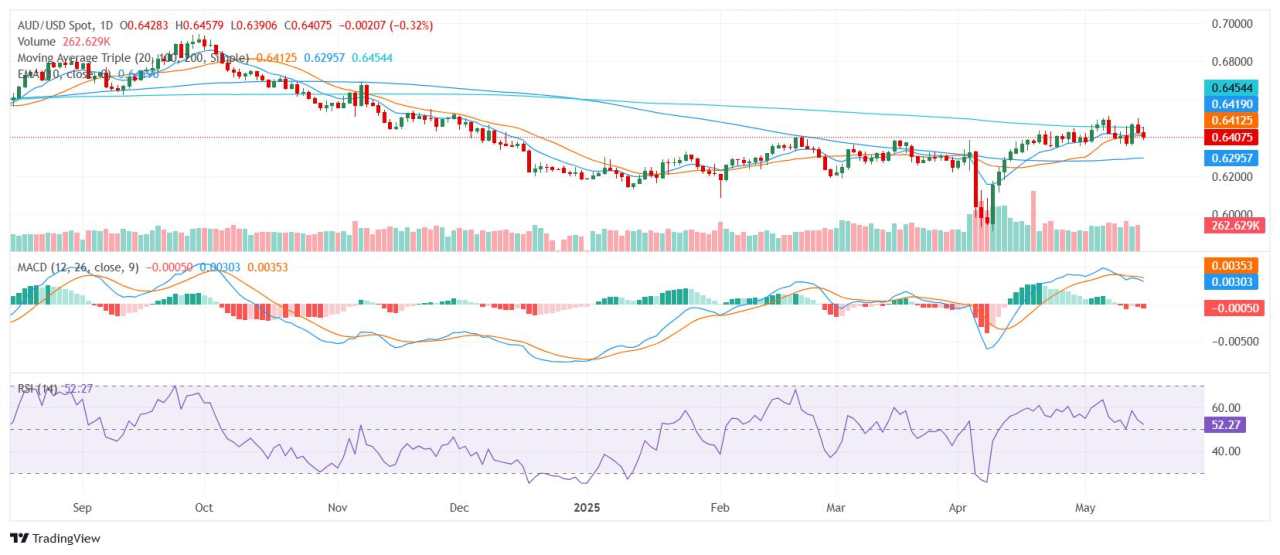
Technically, AUD/USD signals remain mixed. The Relative Strength Index (RSI) is around 50, reflecting neutral conditions. The MACD suggests selling momentum, aligning with the short-term bias, while Momentum (10) also leans bearish. The Stochastic RSI Fast in the 30s and the Ultimate Oscillator around the 40s further reinforce this neutral to slightly bearish tone. Key support levels are found at 0.6400, 0.6398, and 0.6378, while immediate resistance lies at 0.6412, 0.6414, and 0.6419. The 20-day SMA supports the selling bias, while the 100-day SMA offers a more bullish signal, indicating a complex technical outlook.
With the market still digesting mixed US data and awaiting further guidance from the Federal Reserve, AUD/USD may struggle to break out of its current range, especially if US economic releases continue to highlight a cooling but resilient economy.
Daily Chart
作者:Patricio Martín,文章来源FXStreet,版权归原作者所有,如有侵权请联系本人删除。
风险提示:以上内容仅代表作者或嘉宾的观点,不代表 FOLLOWME 的任何观点及立场,且不代表 FOLLOWME 同意其说法或描述,也不构成任何投资建议。对于访问者根据 FOLLOWME 社区提供的信息所做出的一切行为,除非另有明确的书面承诺文件,否则本社区不承担任何形式的责任。
FOLLOWME 交易社区网址: www.followme.ceo


加载失败()