- AUD/NZD trades near the 1.0900 zone with minor losses on Friday.
- The pair maintains a bullish outlook despite mixed short-term signals.
- Key support is clustered below 1.0880, with resistance near 1.0920.
The AUD/NZD pair is experiencing mild selling pressure on Friday, hovering near the 1.0900 zone as the market approaches the Asian session. Despite the minor losses, the broader technical outlook remains constructive, with several key indicators aligning to support the pair's upward trajectory. However, conflicting short-term signals suggest that further gains may face headwinds, as traders navigate a mix of buy and sell pressures.
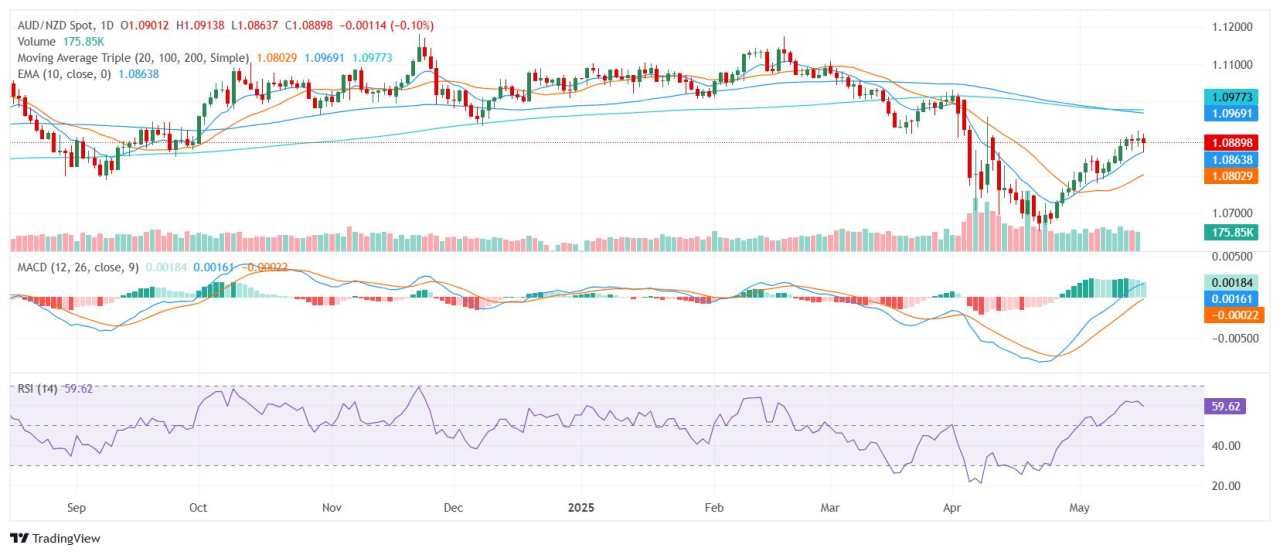
AUD/NZD maintains a generally bullish structure, supported by the alignment of short-term moving averages. The 20-day Simple Moving Average (SMA) indicates a buy signal, reflecting the pair's recent strength, while both the 10-day Exponential Moving Average (EMA) and the 10-day SMA similarly point to upward momentum. However, the broader trend picture remains mixed, as the longer-term 100-day and 200-day SMAs still favor selling, highlighting the potential for deeper pullbacks if bullish momentum falters.
Momentum indicators provide a similarly divided outlook. The Relative Strength Index (RSI) hovers around the 50 level, indicating neutral conditions that align with the current price consolidation. Meanwhile, the Moving Average Convergence Divergence (MACD) signals buy momentum, reinforcing the broader bullish view. In contrast, the Stochastic %K, trading in the 80s, and the Stochastic RSI Fast, positioned in the 90s, both suggest overbought conditions, indicating the potential for near-term corrective moves. The Bull Bear Power, sitting near neutral, further highlights this lack of a decisive trend.
For now, immediate support is expected around 1.0871, with additional levels near 1.0867 and 1.0864. On the upside, resistance is likely to emerge around 1.0914, followed closely by 1.0923 and 1.0945, potentially capping any recovery attempts as the pair struggles to maintain its recent gains.
Daily Chart
作者:Patricio Martín,文章来源FXStreet_id,版权归原作者所有,如有侵权请联系本人删除。
风险提示:本文所述仅代表作者个人观点,不代表 Followme 的官方立场。Followme 不对内容的准确性、完整性或可靠性作出任何保证,对于基于该内容所采取的任何行为,不承担任何责任,除非另有书面明确说明。


加载失败()