- NZD/USD could target the upper side of the rectangle around 0.6010.
- A bullish bias strengthens as the 14-day Relative Strength Index remains above the 50 mark.
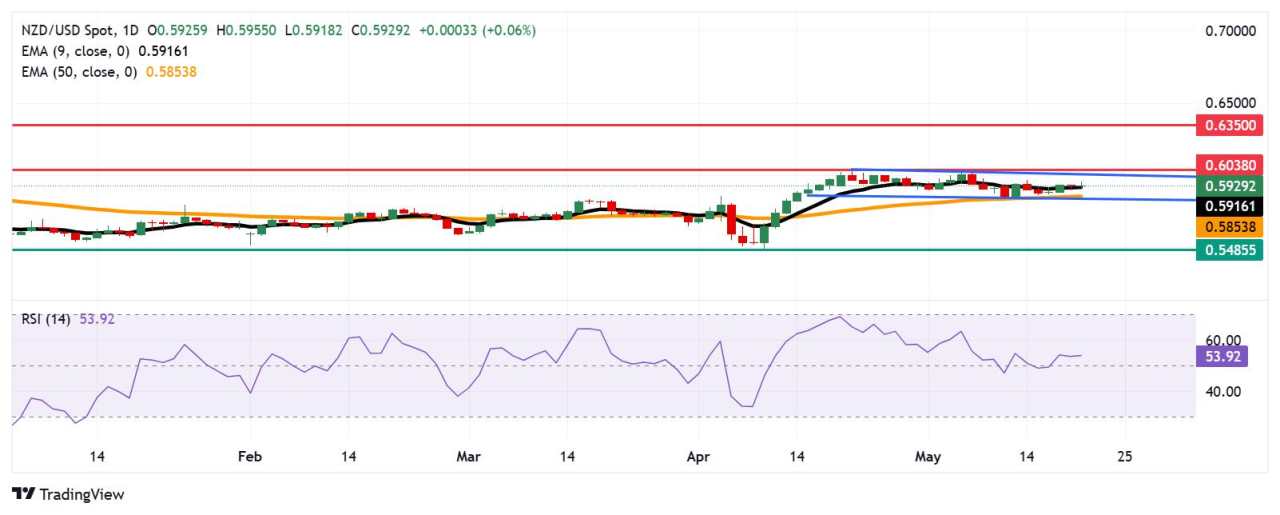
- The primary support appears at the nine-day EMA of 0.5916.
NZD/USD is trading around 0.5940 during the European hours on Wednesday. The pair has retraced its recent losses registered in the previous session as a neutral bias persists, suggested by the technical analysis of the daily chart showing the pair is consolidating within a rectangular pattern.
A bullish bias is expected to be reinforced as the 14-day Relative Strength Index (RSI) remains slightly above the 50 mark. Meanwhile, the NZD/USD pair is positioned above the nine-day Exponential Moving Average (EMA), indicating a short-term price momentum is stronger.
The NZD/USD pair may aim for the upper boundary of the rectangle around 0.6010. A further barrier appears at the six-month high of 0.6038, which was last reached in November 2024. A decisive break above this key resistance level could open the doors for a move toward the seven-month high around 0.6350, reached in October 2024.
The NZD/USD pair could test the initial support at the nine-day EMA of 0.5916 on the downside. Further depreciation below this level would weaken the short-term price momentum and potentially drive the pair toward the 50-day EMA at 0.5853. Further decline would encounter the rectangle’s lower boundary around 0.5830. A sustained move beneath this crucial support zone could further dampen medium-term price momentum, paving the way for a deeper decline toward 0.5485, a level not seen since March 2020.
NZD/USD: Daily Chart
New Zealand Dollar PRICE Today
The table below shows the percentage change of New Zealand Dollar (NZD) against listed major currencies today. New Zealand Dollar was the strongest against the US Dollar.
| USD | EUR | GBP | JPY | CAD | AUD | NZD | CHF | |
|---|---|---|---|---|---|---|---|---|
| USD | -0.38% | -0.14% | -0.27% | -0.20% | -0.30% | -0.10% | -0.42% | |
| EUR | 0.38% | 0.25% | 0.07% | 0.16% | 0.10% | 0.29% | -0.04% | |
| GBP | 0.14% | -0.25% | -0.14% | -0.07% | -0.15% | 0.05% | -0.30% | |
| JPY | 0.27% | -0.07% | 0.14% | 0.08% | -0.01% | 0.18% | -0.14% | |
| CAD | 0.20% | -0.16% | 0.07% | -0.08% | -0.10% | 0.12% | -0.23% | |
| AUD | 0.30% | -0.10% | 0.15% | 0.01% | 0.10% | 0.20% | -0.13% | |
| NZD | 0.10% | -0.29% | -0.05% | -0.18% | -0.12% | -0.20% | -0.33% | |
| CHF | 0.42% | 0.04% | 0.30% | 0.14% | 0.23% | 0.13% | 0.33% |
The heat map shows percentage changes of major currencies against each other. The base currency is picked from the left column, while the quote currency is picked from the top row. For example, if you pick the New Zealand Dollar from the left column and move along the horizontal line to the US Dollar, the percentage change displayed in the box will represent NZD (base)/USD (quote).
作者:Akhtar Faruqui,文章来源FXStreet_id,版权归原作者所有,如有侵权请联系本人删除。
风险提示:本文所述仅代表作者个人观点,不代表 Followme 的官方立场。Followme 不对内容的准确性、完整性或可靠性作出任何保证,对于基于该内容所采取的任何行为,不承担任何责任,除非另有书面明确说明。


加载失败()