- US Dollar bounded up and broke the top of the descending channel at 0.8255.
- The Swiss franc is struggling in a risk-on market.
- The daily chart shows a “Morning Star” candle formation, which suggests a potential trend shift.
damage
The US Dollar has bounced up from three-week lows, favoured by a brighter market mood. The CHF is one of the weakest performers on Tuesday, as the improved market sentiment is undermining demand for safe havens.
Investors are still celebrating Trump’s backtrack on his threat to impose 50% tariffs on Europe, which would open a new front on the trade war and severely damage global growth expectations.
The market focus is now on April’s Durable Goods Orders data and May’s Consumer Sentiment, which will shed some light on how the tariff turmoil has affected manufacturing and consumption.
Swiss Franc PRICE Today
The table below shows the percentage change of Swiss Franc (CHF) against listed major currencies today. Swiss Franc was the strongest against the Japanese Yen.
| USD | EUR | GBP | JPY | CAD | AUD | NZD | CHF | |
|---|---|---|---|---|---|---|---|---|
| USD | 0.34% | 0.15% | 0.85% | 0.22% | 0.67% | 0.83% | 0.75% | |
| EUR | -0.34% | -0.22% | 0.49% | -0.13% | 0.23% | 0.39% | 0.39% | |
| GBP | -0.15% | 0.22% | 0.72% | 0.09% | 0.43% | 0.60% | 0.57% | |
| JPY | -0.85% | -0.49% | -0.72% | -0.60% | -0.18% | -0.09% | -0.09% | |
| CAD | -0.22% | 0.13% | -0.09% | 0.60% | 0.42% | 0.52% | 0.48% | |
| AUD | -0.67% | -0.23% | -0.43% | 0.18% | -0.42% | 0.07% | 0.04% | |
| NZD | -0.83% | -0.39% | -0.60% | 0.09% | -0.52% | -0.07% | -0.07% | |
| CHF | -0.75% | -0.39% | -0.57% | 0.09% | -0.48% | -0.04% | 0.07% |
The heat map shows percentage changes of major currencies against each other. The base currency is picked from the left column, while the quote currency is picked from the top row. For example, if you pick the Swiss Franc from the left column and move along the horizontal line to the US Dollar, the percentage change displayed in the box will represent CHF (base)/USD (quote).
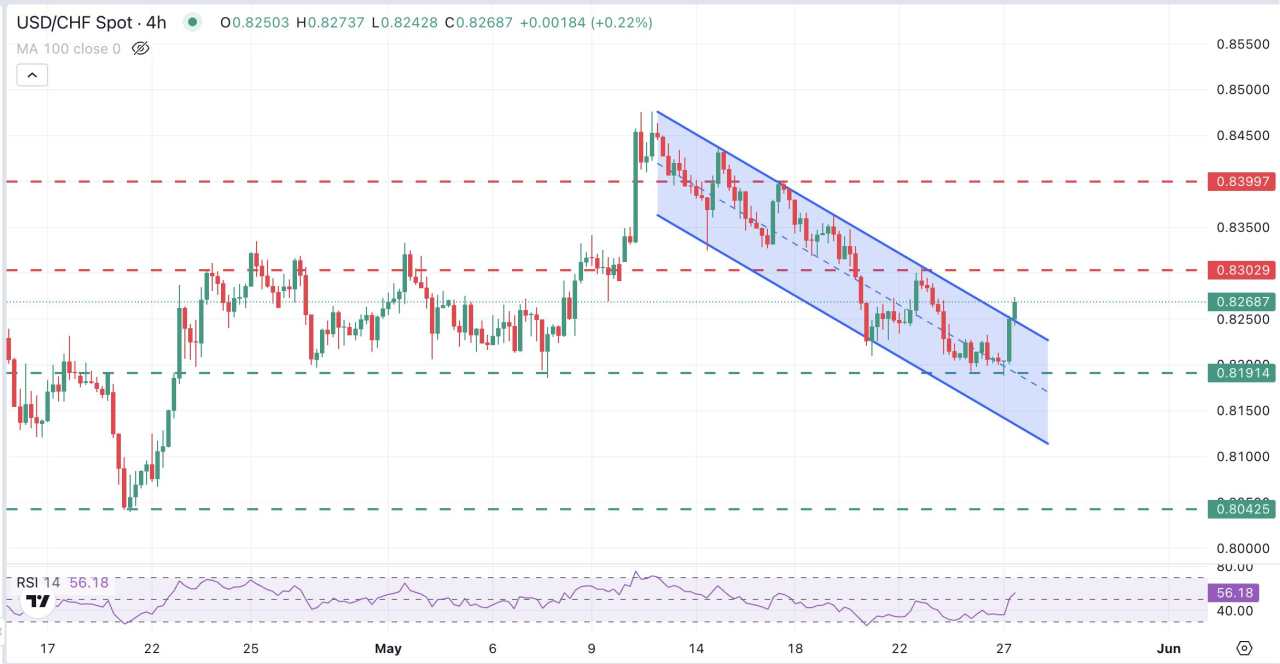
The USD bias improves after breaching the channel top at 0.8255
From a technical perspective, the pair's break of the downside channel is giving bulls hopes to retest the May 22 high at the 0.8300 area. The daily chart shows a morning star formation in process, a bullish sign.
Further appreciation beyond 0.8300 would bring the May 16 high, at 0.8395, into focus. Below 0.8255, supports are at Monday’s 0.8190 low and 0.8120 (April 14, 16 lows and April 21 high).
USD/CHF 4-hour Chart
作者:Guillermo Alcala,文章来源FXStreet,版权归原作者所有,如有侵权请联系本人删除。
风险提示:以上内容仅代表作者或嘉宾的观点,不代表 FOLLOWME 的任何观点及立场,且不代表 FOLLOWME 同意其说法或描述,也不构成任何投资建议。对于访问者根据 FOLLOWME 社区提供的信息所做出的一切行为,除非另有明确的书面承诺文件,否则本社区不承担任何形式的责任。
FOLLOWME 交易社区网址: www.followme.ceo


加载失败()