In this technical article we’re going to look at the Elliott Wave charts of the AUD/JPY forex pair published in members' area of the website. The pair has recently given us a 3 waves bounce that completed precisely at the equal legs area as we expected. In the following text, we’ll explain the Elliott Wave analysis and present target areas.
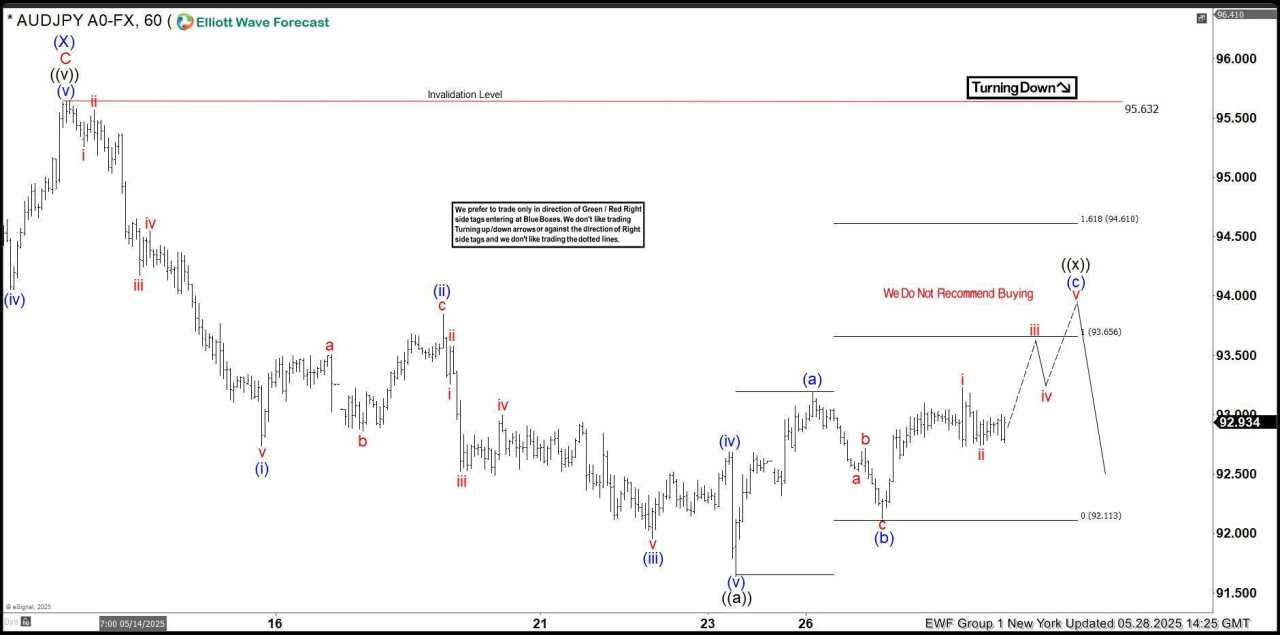
AUD/JPY Elliott Wave one-hour chart 05.28.2025
AUD/JPY is currently forming a three-wave pullback against the 95.63 peak, unfolding as a Zig Zag pattern — (a)-(b)-(c). Our members are aware that we get the potential reversal area by measuring the Equal Legs zone, (a)-(b). This zone comes at 93.65-94.61 area. We expect sellers to emerge within this region and anticipate a continuation of the decline toward new lows ideally.
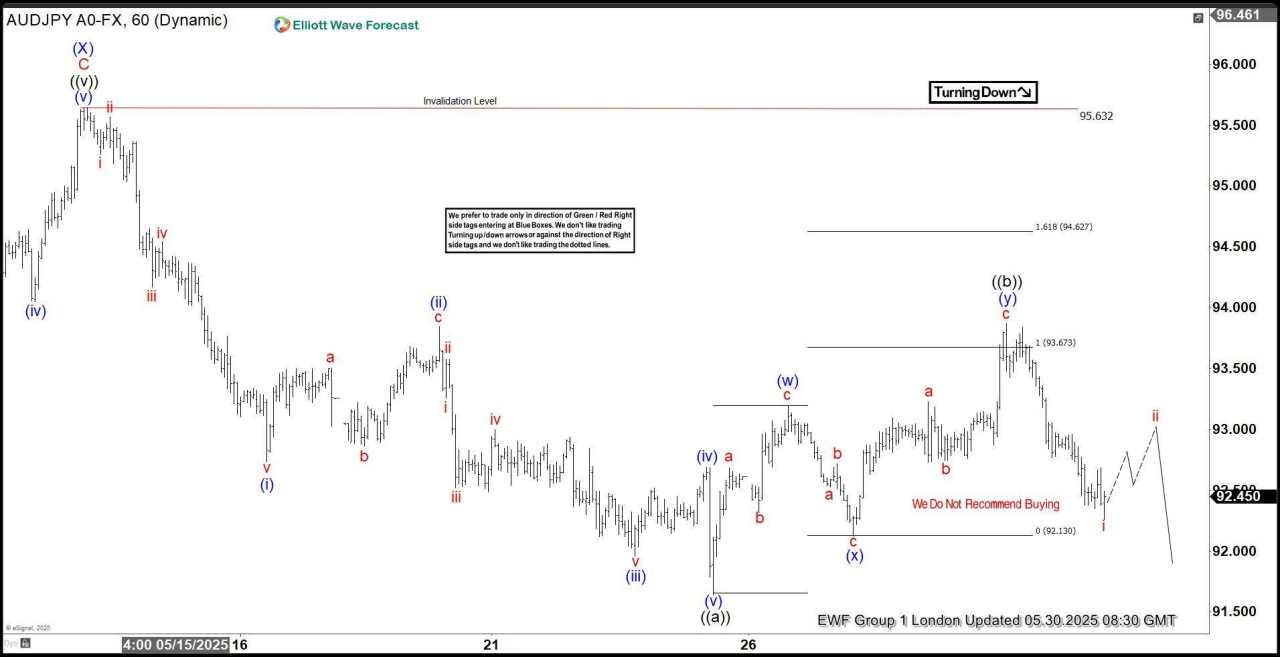
AUD/JPY Elliott Wave one-hour chart 05.28.2025
The pair found sellers as expected in the Equal Legs area and has delivered a decent decline so far. We would now like to see a break below the May 23rd low to confirm that the next leg lower is in place. In that case, further downside extension would be expected, ideally targeting the 89.86 area.
作者:Elliott Wave Forecast Team,文章来源FXStreet,版权归原作者所有,如有侵权请联系本人删除。
风险提示:以上内容仅代表作者或嘉宾的观点,不代表 FOLLOWME 的任何观点及立场,且不代表 FOLLOWME 同意其说法或描述,也不构成任何投资建议。对于访问者根据 FOLLOWME 社区提供的信息所做出的一切行为,除非另有明确的书面承诺文件,否则本社区不承担任何形式的责任。
FOLLOWME 交易社区网址: www.followme.ceo


加载失败()