- AUD/JPY retreats from 93.58 but holds above 92.05, maintaining short-term uptrend.
- Daily close above 93.00 needed to target May 13 high at 95.63 and confirm bullish bias.
- Break below 92.00 could weaken structure and expose Senkou Span B support near 90.83.
The AUD/JPY erased some of its earlier gains, dropping 0.20% late during Wednesday’s North American session, as US equities finished mixed due to worse-than-expected US economic data. At the time of writing, the cross-pair trades at 92.73, after hitting a four-day peak of 93.58.
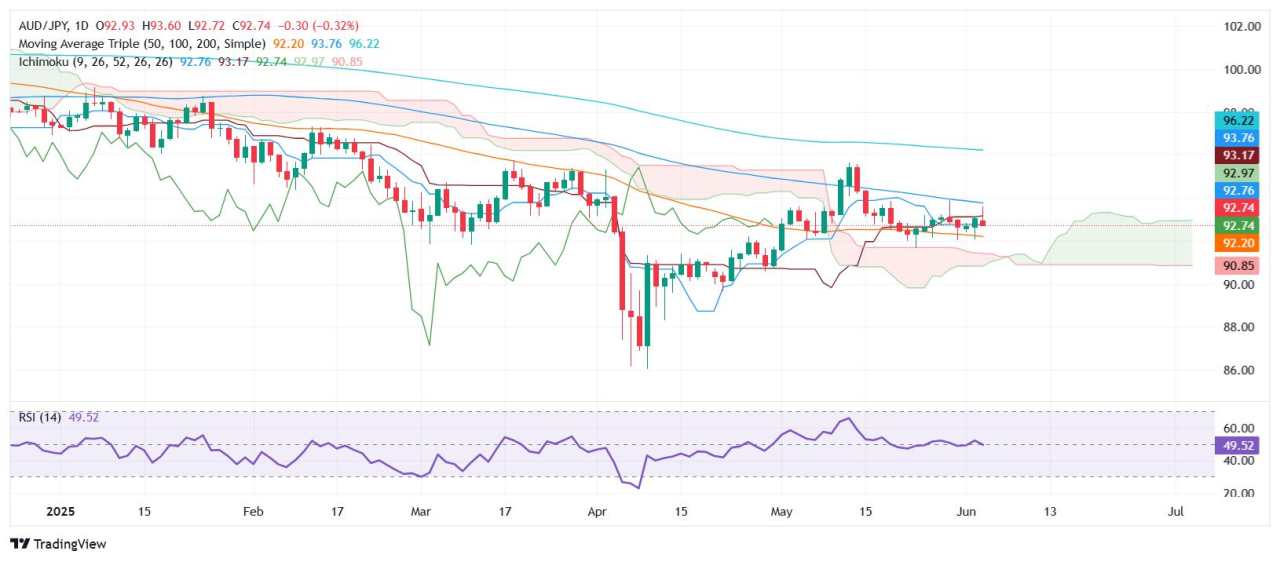
AUD/JPY Price Forecast: Technical outlook
Although the AUD/JPY formed a ‘bullish harami’ candle chart pattern, the pair retreated, but it remains shy of reaching a lower low as it remains above the June 3 daily low of 92.05. Hence, the uptrend, although it remains intact, seems frail.
For a bullish continuation, the AUD/JPY needs a daily close above 93.00. A decisive break will expose the May 13 high of 95.63, shifting the bias to neutral or upwards. A breach of the latter will clear the ath to test February’s high at 97.32, ahead of the year-to-date (YTD) high of 99.15, the January 7 peak.
Conversely, if AUD/JPY tumbles below the May 30 low of 92.00, a fall toward the Senkou Span B at 90.83 is on the cards.
AUD/JPY Price Chart – Daily
Australian Dollar PRICE This week
The table below shows the percentage change of Australian Dollar (AUD) against listed major currencies this week. Australian Dollar was the strongest against the US Dollar.
| USD | EUR | GBP | JPY | CAD | AUD | NZD | CHF | |
|---|---|---|---|---|---|---|---|---|
| USD | -0.62% | -0.64% | -0.73% | -0.46% | -0.90% | -1.10% | -0.60% | |
| EUR | 0.62% | -0.03% | -0.11% | 0.15% | -0.28% | -0.51% | 0.00% | |
| GBP | 0.64% | 0.03% | -0.06% | 0.18% | -0.25% | -0.48% | 0.04% | |
| JPY | 0.73% | 0.11% | 0.06% | 0.28% | -0.17% | -0.35% | 0.04% | |
| CAD | 0.46% | -0.15% | -0.18% | -0.28% | -0.44% | -0.66% | -0.14% | |
| AUD | 0.90% | 0.28% | 0.25% | 0.17% | 0.44% | -0.17% | 0.37% | |
| NZD | 1.10% | 0.51% | 0.48% | 0.35% | 0.66% | 0.17% | 0.52% | |
| CHF | 0.60% | -0.01% | -0.04% | -0.04% | 0.14% | -0.37% | -0.52% |
The heat map shows percentage changes of major currencies against each other. The base currency is picked from the left column, while the quote currency is picked from the top row. For example, if you pick the Australian Dollar from the left column and move along the horizontal line to the US Dollar, the percentage change displayed in the box will represent AUD (base)/USD (quote).
作者:Christian Borjon Valencia,文章来源FXStreet_id,版权归原作者所有,如有侵权请联系本人删除。
风险提示:本文所述仅代表作者个人观点,不代表 Followme 的官方立场。Followme 不对内容的准确性、完整性或可靠性作出任何保证,对于基于该内容所采取的任何行为,不承担任何责任,除非另有书面明确说明。

暂无评论,立马抢沙发