Markets gaming tariffs
Over the past 27 years since I entered “the business,” I’ve seen it all in these markets—LTCM, bursting bubbles, financial collapses, and pandemics. Now, let’s add tariffs, which are just as significant to the economy as the tax reform that launched the bull market in 2017. What’s interesting about the tariffs, however, is the market’s response. In this first chart, the market is pricing in a decline in margins—an expectation that companies will absorb some of the tariff costs—which in turn is projected to weigh on forward earnings growth. Typically, the 10-year yield, as shown in the chart, tracks margin trends, but since “liberation day” in April, it has moved in the opposite direction. So, following Dollar General’s earnings call Tuesday morning, in which the company noted expanding margins, is the market misreading the impact of tariffs?
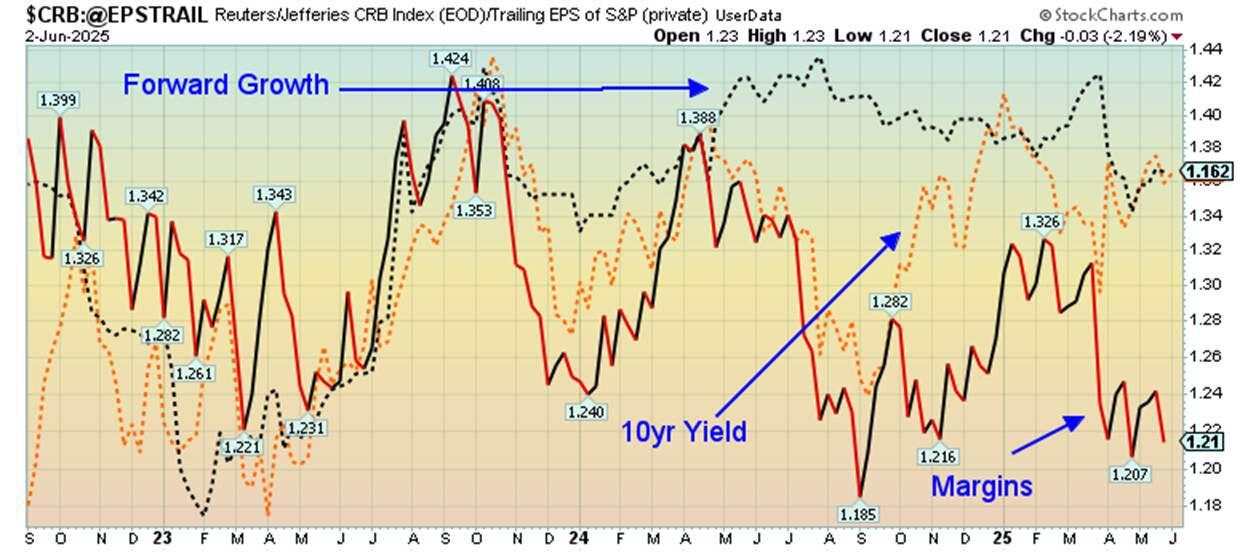
While Dollar General is not the definitive “tell” for the entire market, it does suggest that the extreme conclusions investors have drawn about margin pressures may not materialize, at least in the short term. At the same time, if the 10-year yield is no longer responding to margins but instead to inflation concerns, then consider when the divergence began: last fall’s election. Most believe that current White House has no problem pushing the growth side of the ledger. When combined with the large amount of money in the system, that argues for a potential surge in demand and inflation. Thus the break.
When will the inflation matter?
This next chart shows current Fed overnight policy conditions relative to where the market is pricing they should be. The Fed Fair model—one I created years ago—helps monitor when market conditions are likely to be more volatile than normal. When the fair value of the Fed funds target is below the actual target, markets tend to be choppier, and vice versa. As an aside, some of the greatest equity market “crashes,” if you will, have occurred under tight Fed policy according to this model—but that’s a post for another day. In any case, while the market is pricing in an inflation storm via the 10-year yield, the current Fed funds target remains tight, which argues that inflation should continue to moderate. Today’s PCE reading of 2.5%, down from 2.7% a year ago, supports that view.
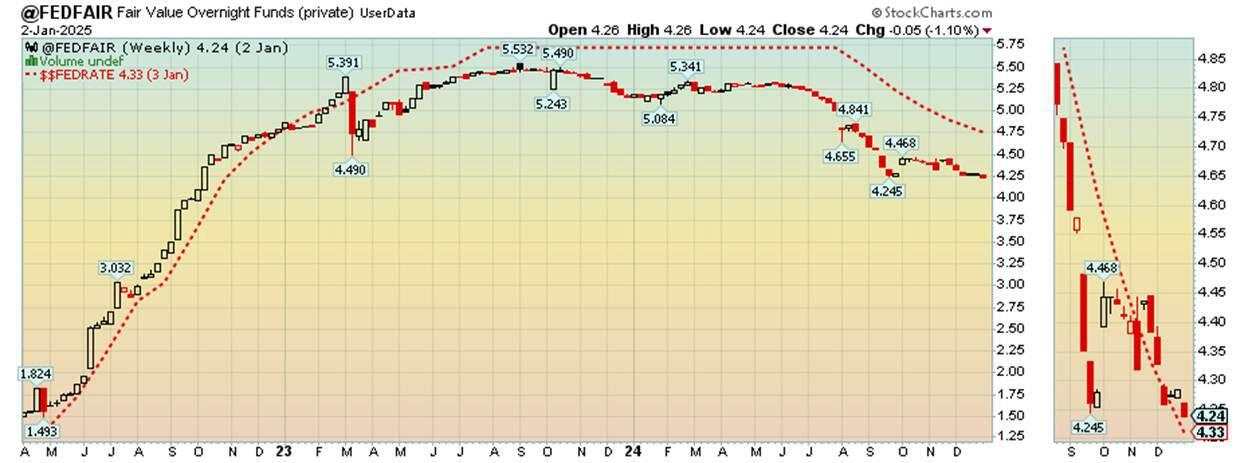
The policy mistake the Fed could make at this point would be cutting rates, which would make this model indicate an “easy” stance—potentially setting the stage for a surge in inflation, theoretically driven by rising demand.
Don’t forget money
While the Fed funds target is an important part of the equation, another key factor to consider is market liquidity and its ultimate effect on inflation. Since the Global Financial Crisis, liquidity has been the primary driver of asset prices. Every major surge in liquidity has coincided with rising asset values, and that dynamic was once again evident this spring, as shown in the chart. With the S&P and broader risk assets selling off this spring, helped by the continued rising risk in volatility and the drop in the Dollar, liquidity surged to offset this drop which turned the VIX lower (higher on this chart) and the S&P 500 higher. As the S&P climbs, remember, wealth increases and thus the “demand available for goods,” also rises.
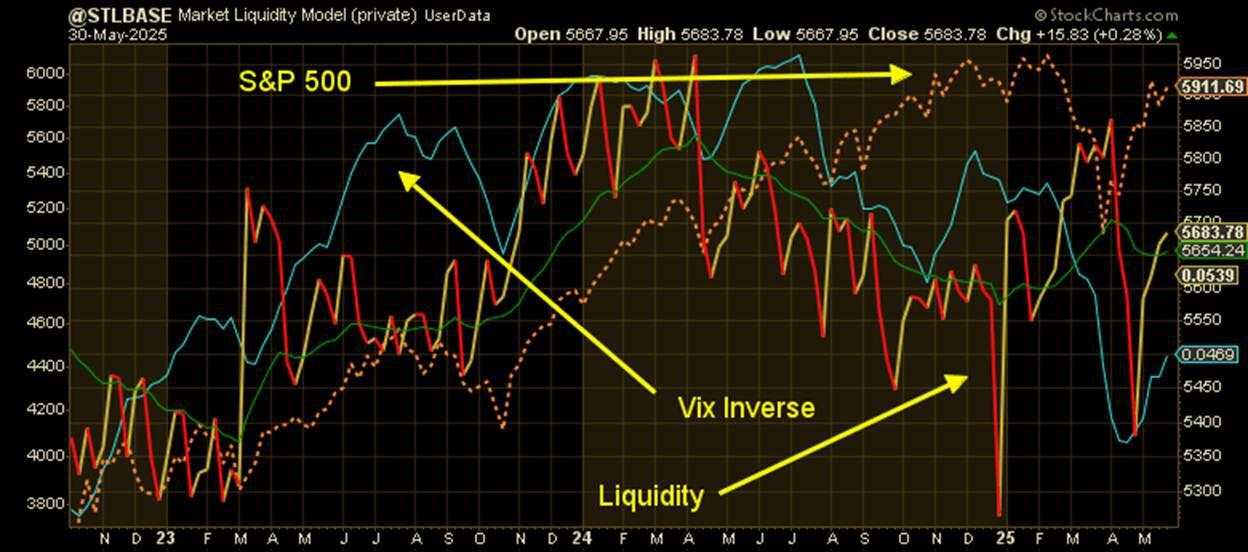
What’s interesting about this surge in liquidity is its volatile nature—massive amounts of money are moving through the system, which could be attributed to factors such as the 10% drop in the S&P or the breakout in Bitcoin. Typically, however, liquidity measures fluctuating this dramatically tend to do more harm than good for the economy, as they increase uncertainty around capital flows. In addition, they impact the banking system and lending conditions, which also impacts the economy. It is the best interest of regulators to have stable money and stable rates, not the opposite.
Banking system rolling?
This next chart features my “banking system” model, which I use as a leading indicator of potential trouble. It has served me well over the years, notably during the GFC and other periods, and incorporates the movement of bank stocks relative to overall market liquidity. As the chart shows, banks rebounded from their lows faster than the broader market (thanks to liquidity), but have since stalled and are now showing signs of a potential rollover. The next two panels display the relative movement of forward EPS to trailing EPS for the S&P 500, which is now moving sideways, suggesting stagnant economic conditions—and the S&P 500 itself, which is approaching prior highs.
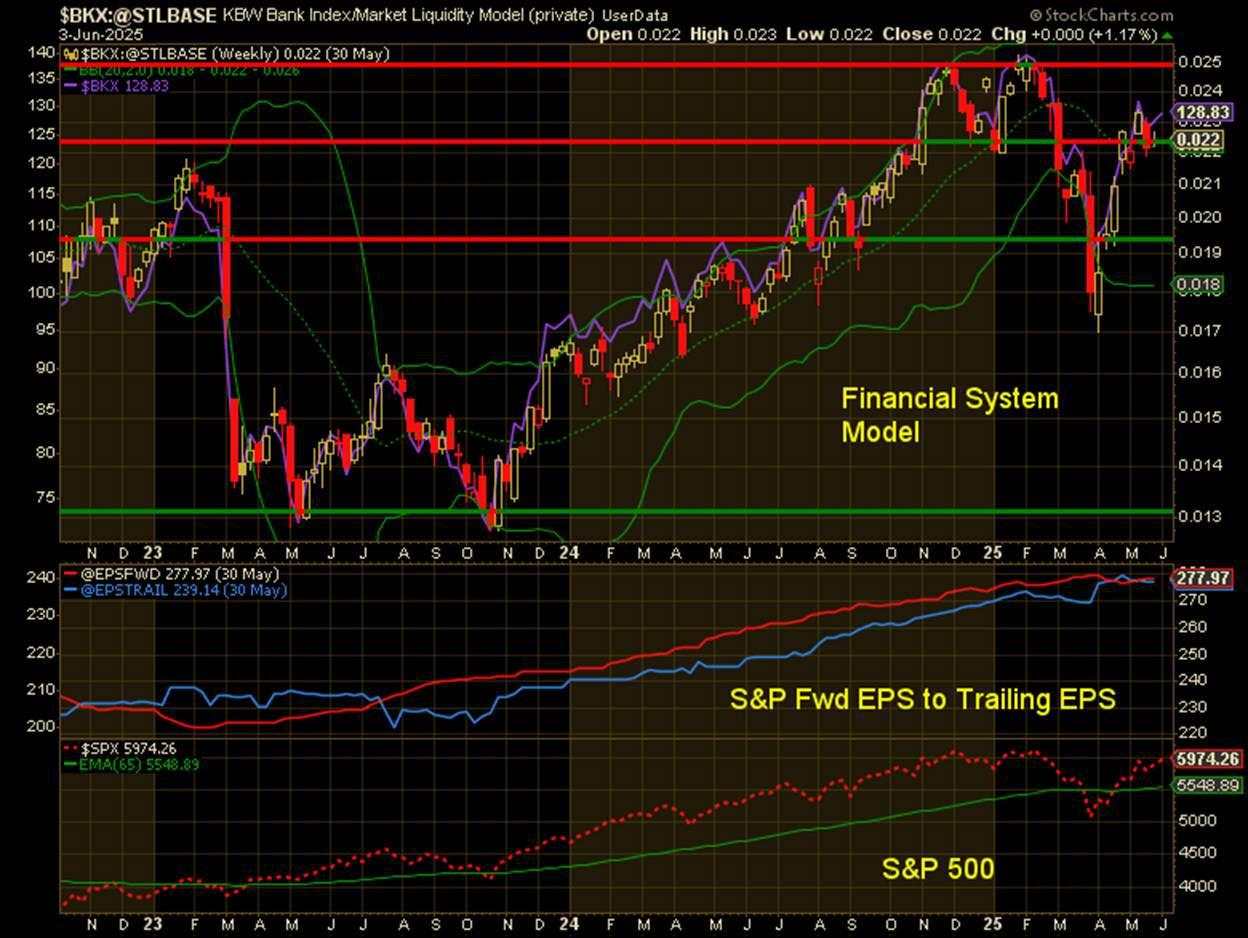
Putting on my trader’s hat, if the banks begin to roll over from current levels, this could very well set up an important top in the S&P 500, even with the recent surge in system-wide liquidity. This is unusual; surging liquidity has historically stabilized the banking sector, with the S&P typically rising alongside it. Is the declining dollar having a destabilizing effect on our banks? Furthermore, if the dollar is experiencing capital flight, could that be what’s creating the gap shown in the first chart, between corporate margins and the 10-year yield? The bottom line for this chart: as goes the banking system, so go risk assets and the broader economy, which brings me to the dollar.
The greenback’s impact
I’m not one to forecast the end of dollar supremacy or echo the many arguments against it, but I find the current movement in the dollar more curious than ever. The chart below shows my Dollar Model compared to the Dollar Index. The model peaked before the end of 2024 and has been declining steadily since January. The spring bounce was sold into, and the dollar has continued to hover near its lows. As it bounces along those lows, interest rates—as shown in the first chart—have been climbing.
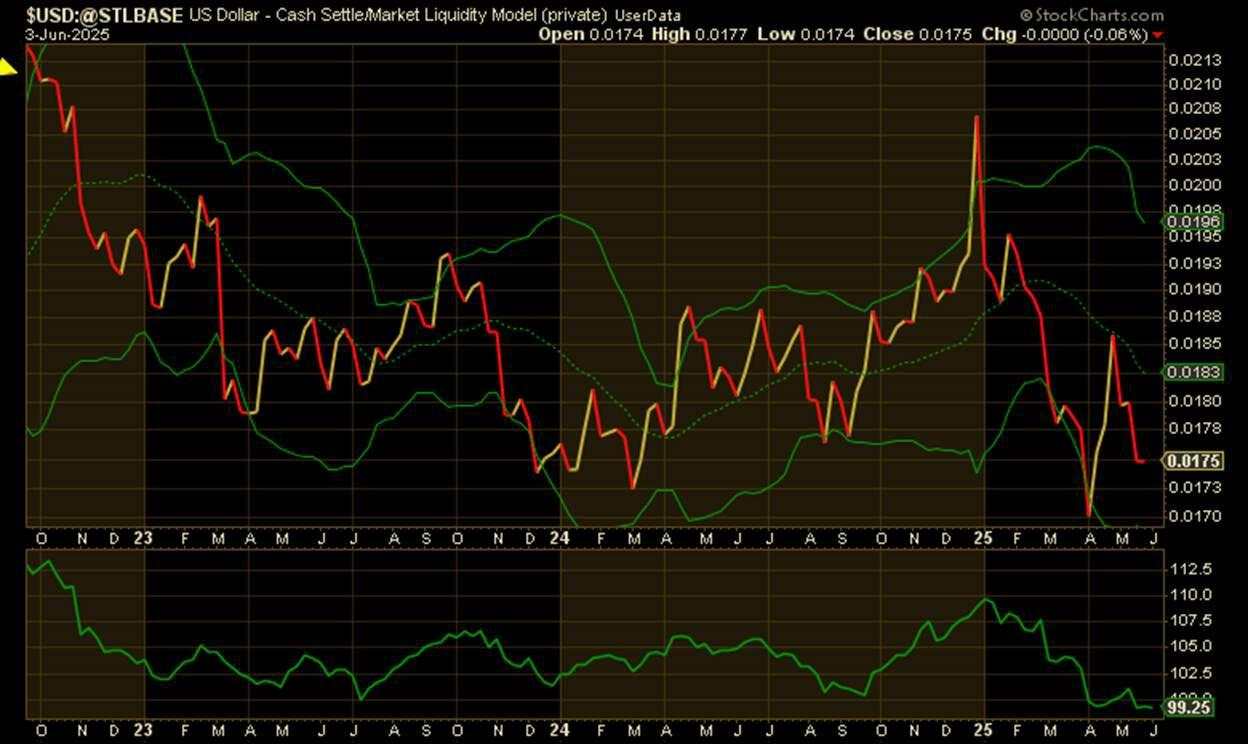
From a technical perspective, the 99–102 range has been a key support zone where buyers have stepped in over the past few years for the Dollar Index. Prior to that, 102 served as the upper bound of the 96–102 range. The recent bounce to 102, followed by consistent selling in the weeks since, suggests that further dollar weakness may be ahead. If 10-year yield, have been sold en masse as the dollar has declined, does this imply, by extension, that interest rates are poised to climb further?
What follows next should be telling for the markets, the banking system and the economy. More on this in the week ahead.
Unlock exclusive gold and silver trading signals and updates that most investors don’t see. Join our free newsletter now!
作者:CMT Association Research Team,文章来源FXStreet,版权归原作者所有,如有侵权请联系本人删除。
风险提示:以上内容仅代表作者或嘉宾的观点,不代表 FOLLOWME 的任何观点及立场,且不代表 FOLLOWME 同意其说法或描述,也不构成任何投资建议。对于访问者根据 FOLLOWME 社区提供的信息所做出的一切行为,除非另有明确的书面承诺文件,否则本社区不承担任何形式的责任。
FOLLOWME 交易社区网址: www.followme.ceo


加载失败()