As of mid-2025, the New Zealand Dollar, known as the Kiwi, against the US Dollar has shown notable resilience, rising to a seven-month high of 0.6055. the rise is largely due to the Reserve Bank of New Zealand (RBNZ) initiating back-to-back rate cuts in april and may of 2025, bringing the cash rate to 3.5% in order to combat inflation and a persistent labor market.
Meanwhile, the Fed has maintained a cautious approach, holding its interest rates at 4.25-4.50% since december 2024. while some Fed officials have acknowledged the possibility of rate cuts later in the year if economic conditions warrant, the prevailing sentiment emphasizes data dependency. Amid this fundamental stance, we will take a look at the pair from more of a technical viewpoint through the rest of this article, reviewing and analyzing different time frames.
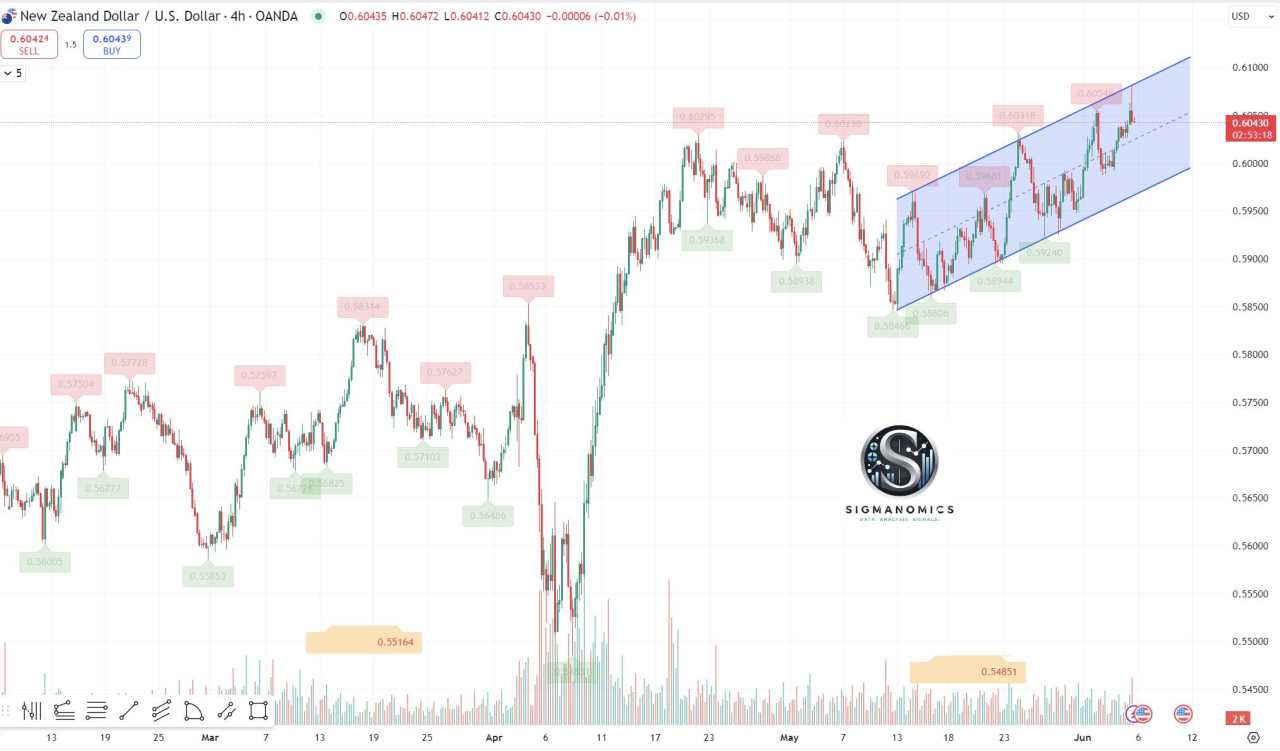
Rising channel on four hour chart
Sigmanomics technical analysis
Examining the Kiwi against the Greenback on the 4-hour chart, the pair has formed a rising channel, albeit with low trading volume, favoring bulls. The relative strength index is also above 50, suggesting positive momentum, without reaching overbought conditions. To the contrary, this rising channel seems to be constrained by what looks like a triple top formation. After recently testing the psychological resistance level at 0.65, traders on both sides should exercise caution, as a potential breakout could influence the near-to-medium-term direction.
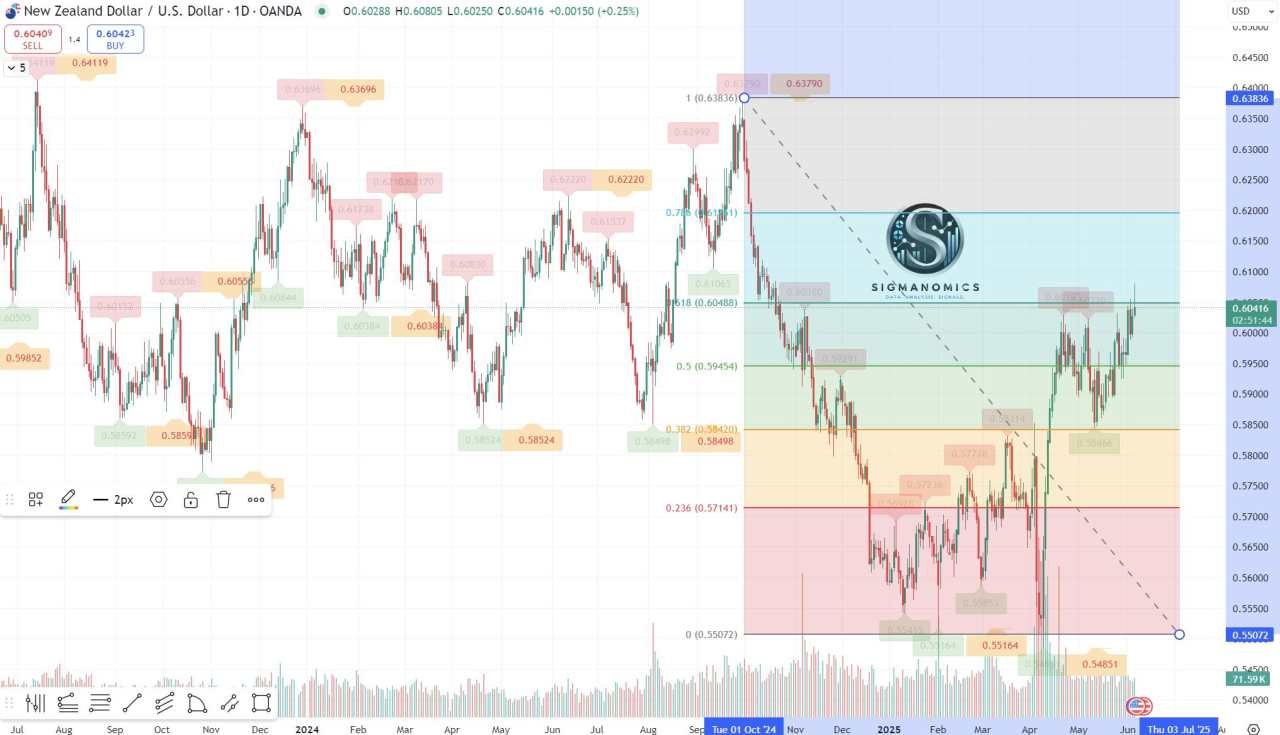
Fibonacci retracement signaling pause on upside gains?
Sigmanomics technical analysis
On the daily chart, the NZD/USD has yet to overcome the 61.8 percent Fibonacci retracment on the September 2024 to April 2025 downswing. This level is not only a major inflection point, but also represents psychological resistance of 0.6050. This bearish technical view also aligns with the bearish divergence of the RBNZ and the Federal Reserve, falling commodity demand, and economic weakness in New Zealand. As long as prices remain below 0.6050, market participants should not rule out a move back towards the pivot of 0.5850.
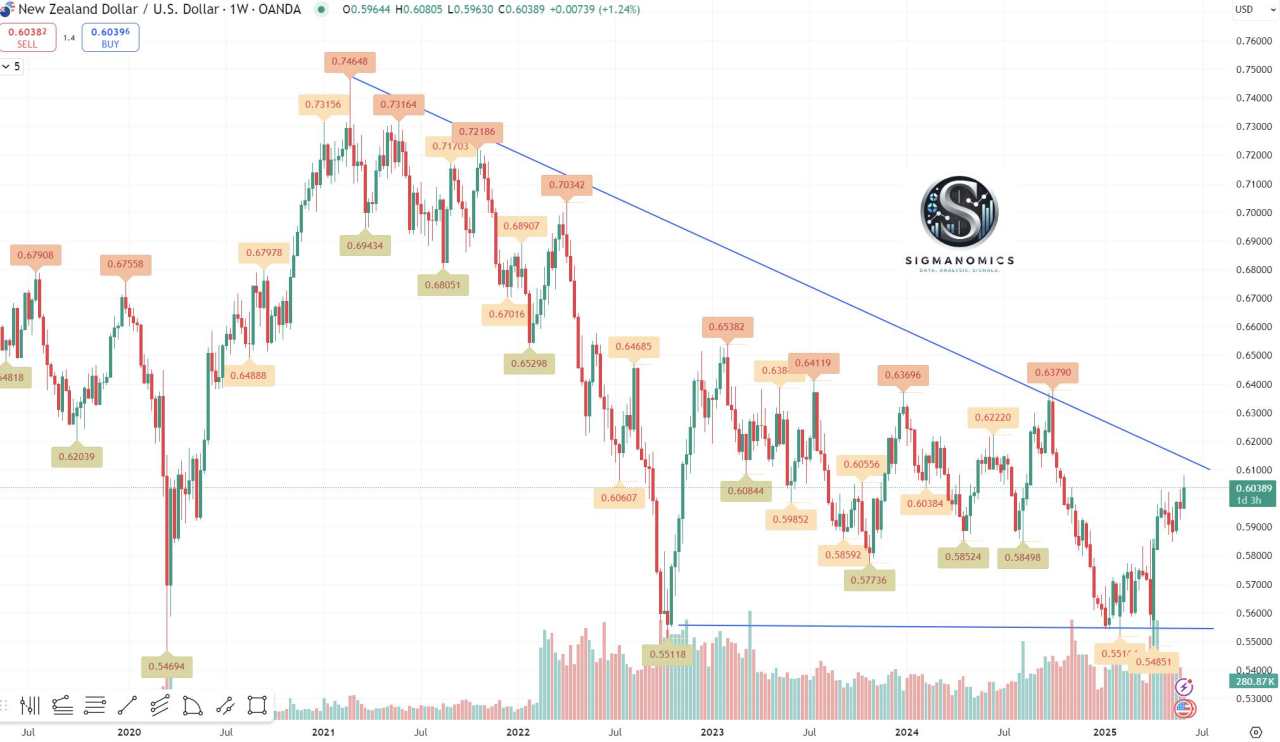
Capped by weekly trendline
Sigmanomics technical analysis
Since the peak of COVID in early 2021, the NZD/USD has been in a prolonged downtrend, as shown on the weekly charts. The pair has faced resistance from a descending trend line, which has established a pattern of lower highs and lower lows over the past four years. Recently, the pair tested critical horizontal support, which indicates the formation of a double bottom. This pattern is often viewed as a bullish reversal signal, particularly when it is followed by strong momentum. Support for the double bottom scenario is also seen in the volume analysis: the second bottom was accompanied by significantly higher bullish volume, suggesting early signs of a shift in sentiment.
From a macroeconomic perspective, the fundamental dynamics between the Reserve Bank of New Zealand (RBNZ) and the U.S. Federal Reserve (Fed) are crucial for determining the direction of the NZD/USD exchange rate in the medium to long term. The RBNZ has maintained a hawkish stance due to a tight labor market and persistent inflation, while the Fed is anticipated to cut interest rates in the second half of 2025. In summary, bullish traders should look for a weekly close above 0.6200 as confirmation of upward momentum. The coming weeks will likely define the medium-term trajectory of NZD/USD and present potential trading opportunities.
作者:Sigmanomics,文章来源FXStreet,版权归原作者所有,如有侵权请联系本人删除。
风险提示:本文所述仅代表作者个人观点,不代表 Followme 的官方立场。Followme 不对内容的准确性、完整性或可靠性作出任何保证,对于基于该内容所采取的任何行为,不承担任何责任,除非另有书面明确说明。


暂无评论,立马抢沙发