- AUD/JPY slips to 93.99 after strong Monday rally fades amid rising geopolitical risks.
- RSI turns neutral, signaling consolidation near key 94.00 level ahead of Fed meeting.
- Downside risks emerge if price breaks below 93.56–93.60 Ichimoku support cluster.
The AUD/JPY reversed its course on Tuesday after posting solid gains on Monday of over 0.98% amid an improvement in market players' mood despite increasing tensions in the Israel-Iran conflict. Nevertheless, reality hit the markets, while a possible involvement of the United States (US) in the conflict shifted sentiment sour. At the time of writing, the cross-pair trades at 93.99, virtually unchanged, after posting losses of 0.37% on Tuesday.
AUD/JPY Price Forecast: Technical outlook
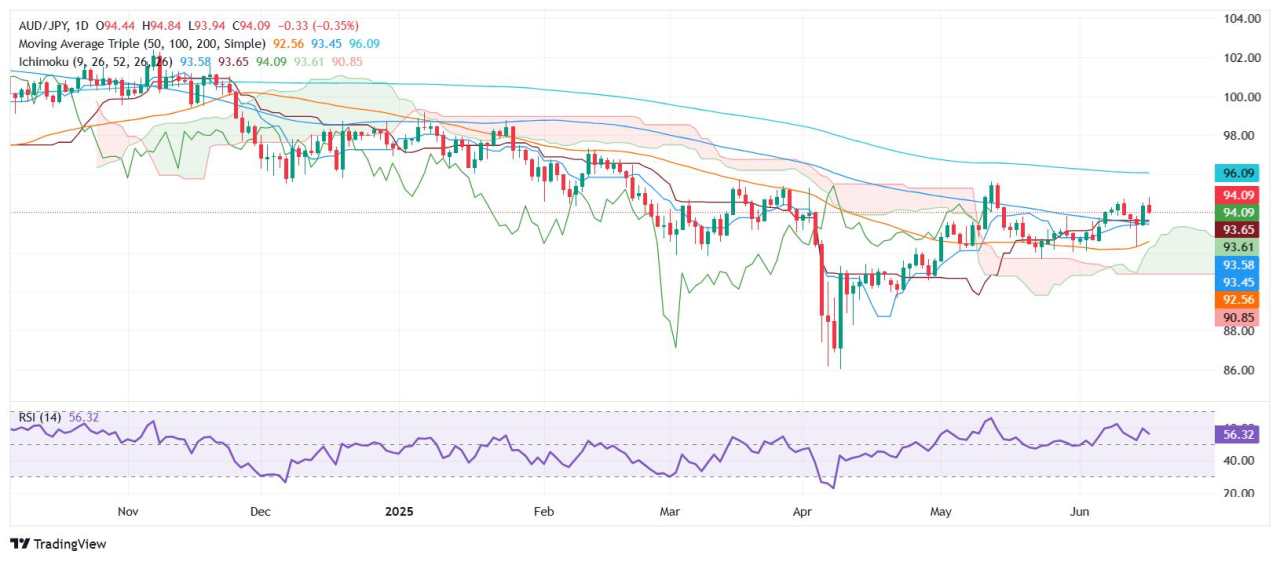
From a technical standpoint, the AUD/JPY seems poised to consolidate on the top/bottom of the 94.00 figure. The Relative Strength Index (RSI) remains bullish, although it is approaching its neutral line, indicating indecision among traders.
If the RSI resumes its upward trend and the AUD/JPY climbs above 94.50, this could pave the way for a bullish reaction. The next key resistance level would be June 17, high at 94.83, followed by the 95.00 figure. A reach of the latter will expose the April 2 peak at 95.30, ahead of February’s monthly high of 97.32.
Conversely, if AUD/JPY slumps below 94.00 and clears the confluence of the Tenkan and Kijun-sen, and the Senkou Span A at around 93.60/93.56, look for a drop toward the June 16 daily low of 93.24, ahead of 93.00.
AUD/JPY Price Chart – Daily
Australian Dollar PRICE This week
The table below shows the percentage change of Australian Dollar (AUD) against listed major currencies this week. Australian Dollar was the strongest against the Japanese Yen.
| USD | EUR | GBP | JPY | CAD | AUD | NZD | CHF | |
|---|---|---|---|---|---|---|---|---|
| USD | 0.49% | 0.99% | 0.52% | 0.67% | 0.08% | 0.02% | 0.54% | |
| EUR | -0.49% | 0.38% | 0.00% | 0.18% | -0.28% | -0.44% | 0.05% | |
| GBP | -0.99% | -0.38% | -0.35% | -0.19% | -0.66% | -0.84% | -0.33% | |
| JPY | -0.52% | 0.00% | 0.35% | 0.17% | -0.72% | -0.80% | -0.39% | |
| CAD | -0.67% | -0.18% | 0.19% | -0.17% | -0.52% | -0.65% | -0.14% | |
| AUD | -0.08% | 0.28% | 0.66% | 0.72% | 0.52% | -0.18% | 0.34% | |
| NZD | -0.02% | 0.44% | 0.84% | 0.80% | 0.65% | 0.18% | 0.52% | |
| CHF | -0.54% | -0.05% | 0.33% | 0.39% | 0.14% | -0.34% | -0.52% |
The heat map shows percentage changes of major currencies against each other. The base currency is picked from the left column, while the quote currency is picked from the top row. For example, if you pick the Australian Dollar from the left column and move along the horizontal line to the US Dollar, the percentage change displayed in the box will represent AUD (base)/USD (quote).
作者:Christian Borjon Valencia,文章来源FXStreet,版权归原作者所有,如有侵权请联系本人删除。
风险提示:以上内容仅代表作者或嘉宾的观点,不代表 FOLLOWME 的任何观点及立场,且不代表 FOLLOWME 同意其说法或描述,也不构成任何投资建议。对于访问者根据 FOLLOWME 社区提供的信息所做出的一切行为,除非另有明确的书面承诺文件,否则本社区不承担任何形式的责任。
FOLLOWME 交易社区网址: www.followme.ceo


加载失败()