- XAG/USD slips for a second day, easing from a fresh 12-year high near $37.32.
- Geopolitical tensions and structural supply deficits keep the medium-term outlook bullish.
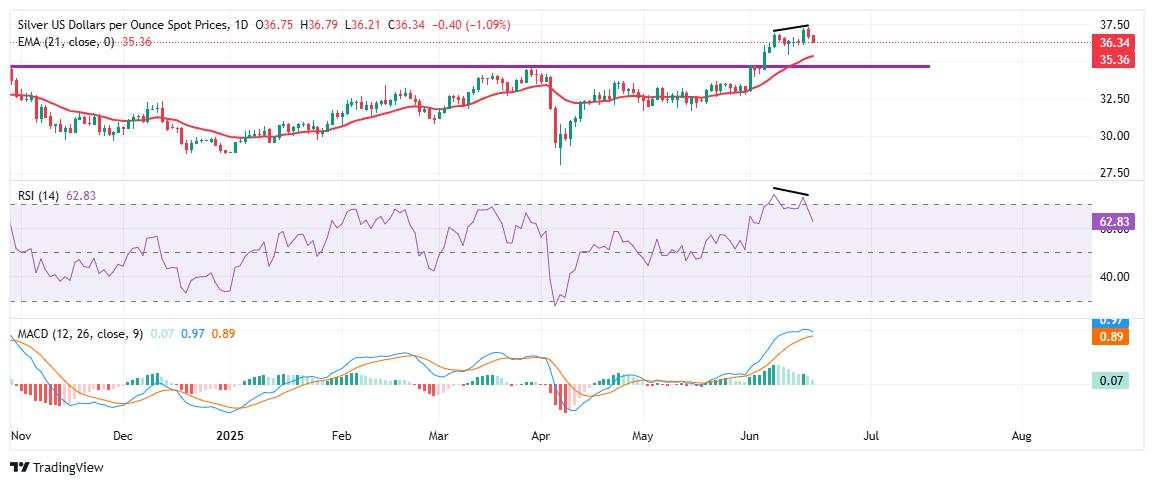
- Daily RSI shows bearish divergence; key support seen at $35.30–$35.50 zone.
The Silver (XAG/USD) edges lower for the second consecutive day on Thursday, retreating from a fresh multi-year high of $37.32 touched on Wednesday, as traders lock in profits following the Federal Reserve’s (Fed) cautious policy pause. The Fed held rates steady but signaled that borrowing costs may remain elevated for longer, giving the US Dollar some breathing room and weighing slightly on precious metals.
At the time of writing, XAG/USD is down about 1.10% on the day as the metal backs away from its highest level since 2012, drifting lower during the American session to trade near $36.35.
This cooling comes after an impressive rally fueled by a mix of structural supply tightness, elevated safe-haven demand, and a broadly softer US Dollar. Heightened tensions between Israel and Iran have kept geopolitical risks on the radar, prompting steady haven flows into Silver alongside Gold. The latest retreat primarily reflects healthy profit-taking and a modest rebound in the Greenback, as traders digest the Fed’s cautious tone and recalibrate their near-term risk appetite. Despite the dip, the white metal remains up sharply for the month and continues to hold a constructive technical bias.
On the macro front, Silver remains underpinned by strong industrial demand, especially from solar panels and electric vehicles, which has kept the global market in deficit for a fifth straight year. According to recent reports, 2025 is expected to see a supply shortfall of over 110 million ounces — one of the widest in a decade — lending solid fundamental support for prices on dips.
From a technical perspective, Silver’s broader trend remains bullish, but near-term momentum shows signs of fatigue. The daily chart highlights a developing bearish divergence between price action and the Relative Strength Index (RSI). While spot Silver printed a higher high, the RSI failed to confirm and is now easing from overbought territory, slipping below its previous peak. This classic divergence often signals that bullish momentum may be losing steam, hinting at a potential short-term correction. Meanwhile, the Moving Average Convergence Divergence (MACD) remains positive but is starting to lose upside strength, reinforcing the caution signal from the RSI.
The immediate support zone comes in near the $35.30–$35.50 area, which aligns with the 21-day Exponential Moving Average (EMA) and the recent breakout level. Sustained weakness below this region could trigger a deeper pullback toward the horizontal support around $34.50 — an area that capped multiple tops over the past year and has now turned into a key floor.
On the other hand, if buyers rally above $36.50, the bulls may attempt to retest the $37.30 zone, with a potential extension toward $38.00 if momentum picks up again.
作者:Vishal Chaturvedi,文章来源FXStreet_id,版权归原作者所有,如有侵权请联系本人删除。
风险提示:本文所述仅代表作者个人观点,不代表 Followme 的官方立场。Followme 不对内容的准确性、完整性或可靠性作出任何保证,对于基于该内容所采取的任何行为,不承担任何责任,除非另有书面明确说明。


加载失败()