- EUR/CAD may find the initial resistance at the nine-week high of 1.5845.
- The 14-day Relative Strength Index remains above the 50 level, suggesting a strengthening bullish bias.
- The immediate support appears at the nine-day Exponential Moving Average of 1.5717.
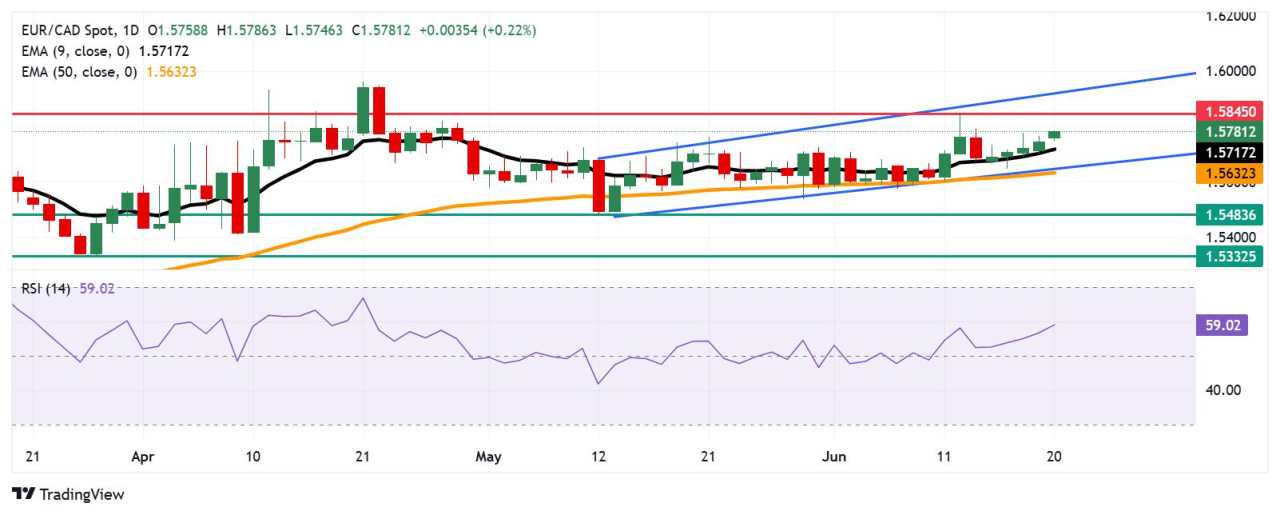
EUR/CAD extends its winning streak for the fifth consecutive day, trading around 1.5780 during the Asian hours on Friday. Technical analysis on the daily chart indicates a strengthening bullish bias as the currency cross moves upwards within the ascending channel pattern.
The EUR/CAD cross rises above the 50-day Exponential Moving Average (EMA), suggesting that short-term price momentum is strengthening. Additionally, the 14-day Relative Strength Index (RSI) is positioned above the 50 level, suggesting a persistent bullish bias.
On the upside, the EUR/CAD cross may target the primary barrier at the nine-week high of 1.5845, which was marked on June 12. A break above this level could reinforce the bullish bias and lead the pair to test the upper boundary of the ascending channel around 1.5920.
The EUR/CAD cross may find immediate support at the nine-day Exponential Moving Average (EMA) of 1.5717. A break below this level could weaken the short-term price momentum and put downward pressure on the currency cross to test the ascending channel’s lower boundary around 1.5650, aligned with the 50-day EMA of 1.5632. A successful break below this crucial support zone could weaken the bullish bias and prompt the currency cross to navigate the area around the 11-week low of 1.5483, recorded on May 12.
EUR/CAD: Daily Chart
Euro PRICE Today
The table below shows the percentage change of Euro (EUR) against listed major currencies today. Euro was the strongest against the Swiss Franc.
| USD | EUR | GBP | JPY | CAD | AUD | NZD | CHF | |
|---|---|---|---|---|---|---|---|---|
| USD | -0.23% | -0.18% | -0.06% | -0.13% | -0.32% | -0.14% | 0.00% | |
| EUR | 0.23% | 0.02% | 0.17% | 0.11% | 0.05% | 0.10% | 0.25% | |
| GBP | 0.18% | -0.02% | 0.24% | 0.09% | 0.06% | 0.08% | 0.23% | |
| JPY | 0.06% | -0.17% | -0.24% | -0.02% | -0.28% | -0.23% | 0.01% | |
| CAD | 0.13% | -0.11% | -0.09% | 0.02% | -0.16% | -0.25% | 0.14% | |
| AUD | 0.32% | -0.05% | -0.06% | 0.28% | 0.16% | 0.30% | 0.17% | |
| NZD | 0.14% | -0.10% | -0.08% | 0.23% | 0.25% | -0.30% | 0.15% | |
| CHF | -0.01% | -0.25% | -0.23% | -0.01% | -0.14% | -0.17% | -0.15% |
The heat map shows percentage changes of major currencies against each other. The base currency is picked from the left column, while the quote currency is picked from the top row. For example, if you pick the Euro from the left column and move along the horizontal line to the US Dollar, the percentage change displayed in the box will represent EUR (base)/USD (quote).
作者:Akhtar Faruqui,文章来源FXStreet,版权归原作者所有,如有侵权请联系本人删除。
风险提示:以上内容仅代表作者或嘉宾的观点,不代表 FOLLOWME 的任何观点及立场,且不代表 FOLLOWME 同意其说法或描述,也不构成任何投资建议。对于访问者根据 FOLLOWME 社区提供的信息所做出的一切行为,除非另有明确的书面承诺文件,否则本社区不承担任何形式的责任。
FOLLOWME 交易社区网址: www.followme.ceo


加载失败()